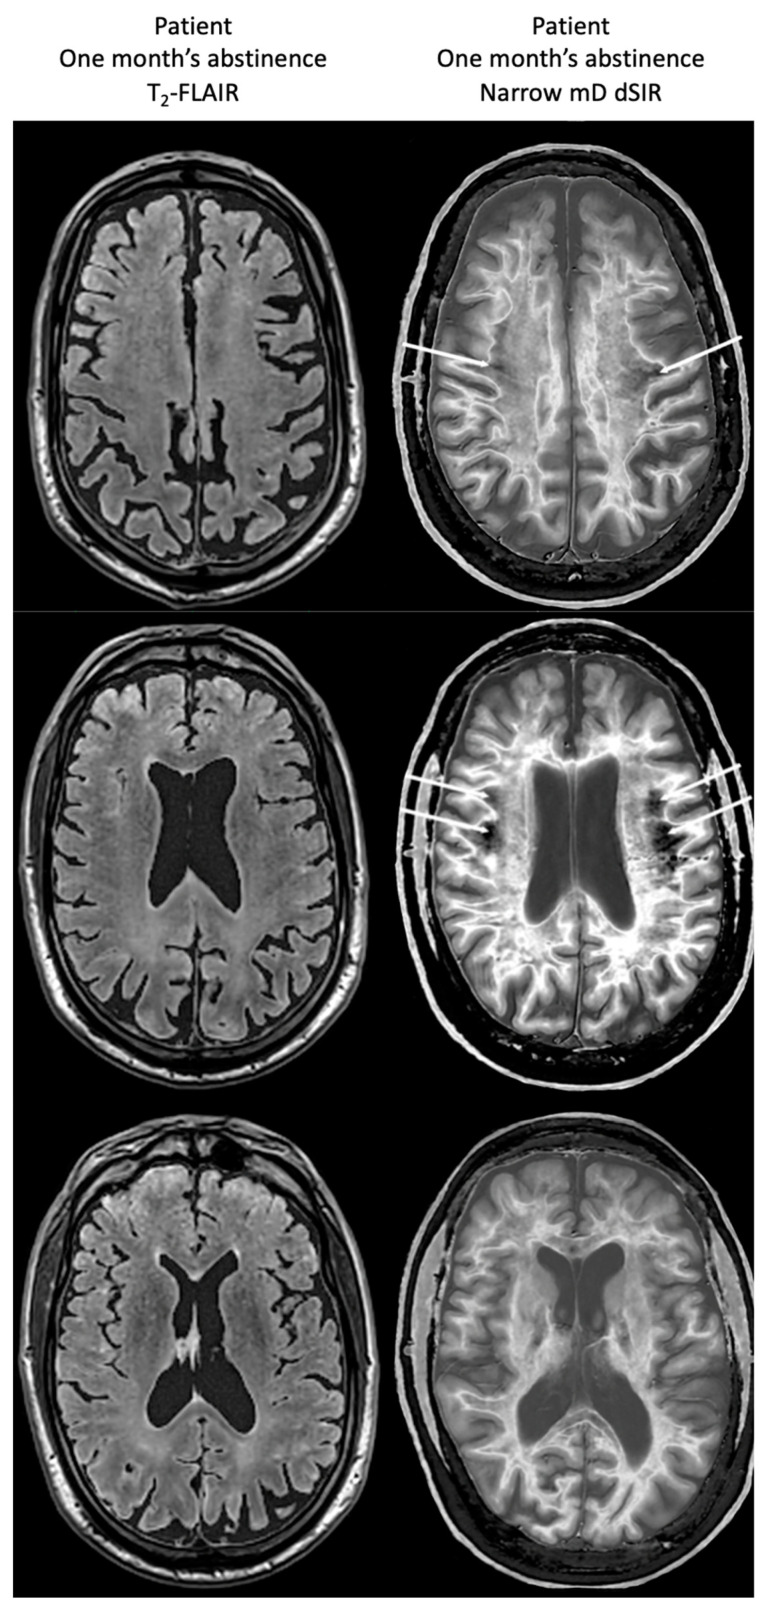
Figure 18.
Case 1 patient with methamphetamine use disorder. Comparison of T2-FLAIR and narrow mD dSIR images. No abnormality is seen on the T2-FLAIR images (left column) but there are extensive areas of higher signal in approximately 90% of the white matter (right column). Only small areas of normal low signal are seen in the white matter (white arrows) (right column). The appearances on the dSIR images are consistent with a whiteout sign grade 4.

