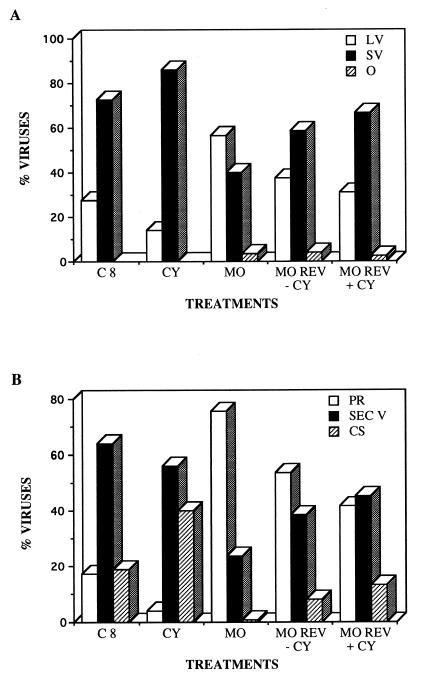
FIG. 5.
Quantitative aspects of the effects of the different treatments on TGEV morphogenesis. Quantification included large viruses (LV), small viruses (SV), and those viruses that cannot be included in these two categories (other [O]), which could represent aberrant assemblies or new maturation intermediates. (A) Percentages of viruses with the different morphologies among normally infected (control) cells at 8 h p.i. (C8) and among infected cells subjected to different treatments: infected cells (8 h p.i.) treated with cycloheximide for 30 min (CY), infected cells (8 h p.i.) treated with monensin (MO) (the drug was added to the cultures at 3 h p.i.), and cells after reversion of the monensin blockade (MO REV) that were incubated for 2 h without monensin in the absence of cycloheximide (−CY) or without monensin in the presence of cycloheximide (+CY). (B) Percentages of viral particles in different cellular regions of normally infected cells and in infected cells subjected to the treatments described above. The different cellular locations studied were the perinuclear region (PR), the secretory vesicles (SEC V), and the extracellular cell surface (CS). A total of 4,531 viruses (at least 700 per treatment) were included in the quantification.

