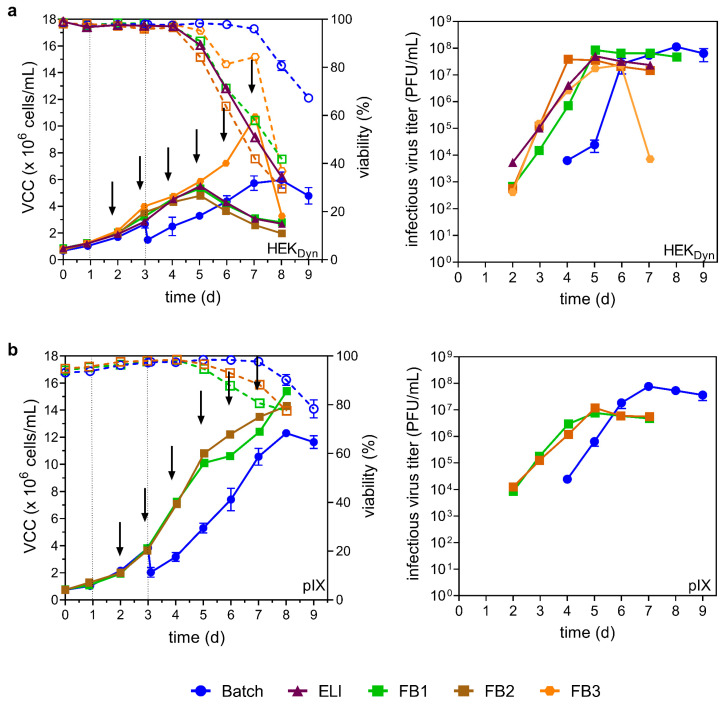
Figure 3.
YF-ZIK production using HEKDyn (a) and pIX (b) cells in batch, ELI mode, and fed-batch mode. Values from batch mode (blue circles) from Figure 2c for comparison. VCCs (full symbols) and viability (empty symbols and dashed lines) are shown left, infectious virus titer right. For productions using early low infection mode (ELI, purple triangle) or fed-batch modes (FB1–3), cells were already infected one day after inoculation. Feeds used for fed-batch mode were media (FB1, green square), CHO Feed 1 (FB2, brown square), or HEKFS (FB3, orange circle). Arrows indicate the time of feeding; dashed lines indicate time of infection. Values from single experiments, except batch runs, are shown as mean ± STD with n = 3. Working volume increase due to feed: FB1 20%, FB2 18%, FB3 33%. Infectious virus titer and VCC are not corrected for volume increase.

