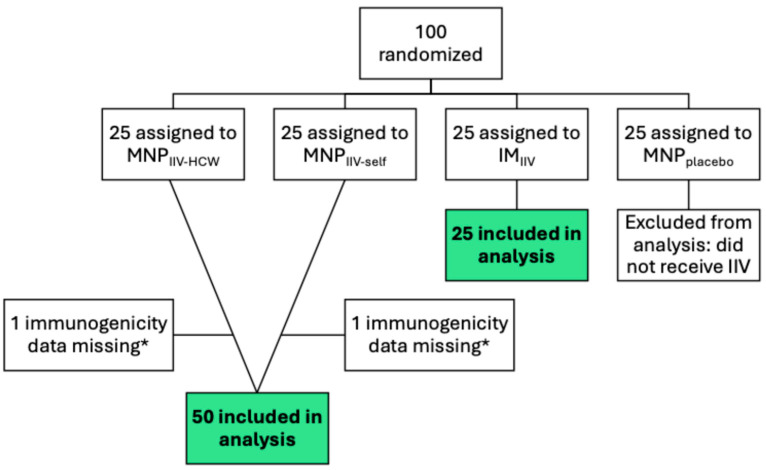
Figure 1.
Participant Flow Diagram. Adapted from TIV-MNP 2015 [49] for secondary analysis. * Reactogenicity and covariate data of participants with missing immunogenicity data were included. Green boxes with bold type represent the participants included in the sample for analysis.

