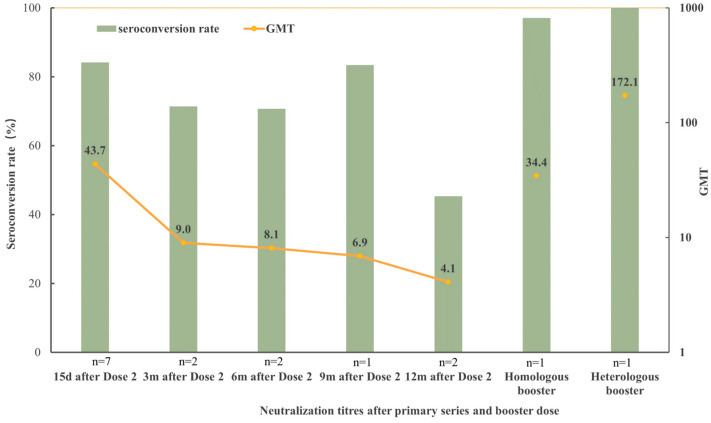
Figure 3.
Neutralizing antibodies for the ancestral strain of the live SARS-CoV-2 virus after the primary series and boosters. The bar graphs indicate the trend of the seroconversion rate after two doses of inactivated vaccinations or booster immunization. The line graph connected by yellow dots indicates the trend of GMT after receiving two doses of the inactivated vaccine; the dots for booster immunization are not connected, just displayed.

