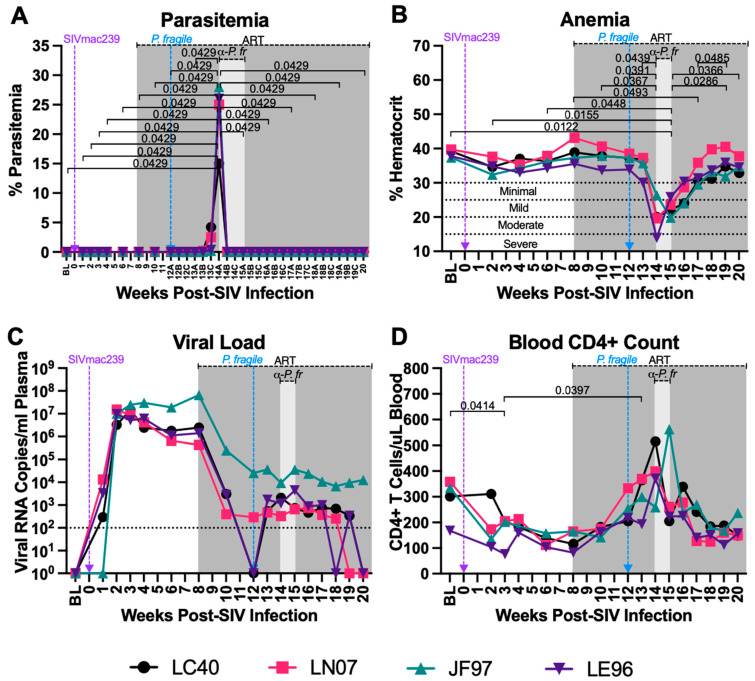
Figure 2.
P. fragile co-infection results in clinical signs of SIV infection despite persistent, daily ART. Peripheral P. fragile parasitemia, anemia, SIVmac239 peripheral-blood viral loads (VLs), and blood CD4+ T-cell counts were assessed in adult, male rhesus macaques (RMs) (n = 4). (A) Following P. fragile inoculation at week 12 post-SIV infection (p.i.), parasitemia was assessed tri-weekly, indicated as weeks A, B, and C p.i. % Parasitemia was assessed via Giemsa staining of thin blood smears and was defined as the percentage of erythrocytes infected by a parasite among all erythrocytes. (B) Anemia was assessed by characterizing % hematocrit, defined as the ratio of red blood cells to total blood. (C) Plasma VLs (RNA copies/milliliter plasma) were assessed by qPCR. (D) Absolute number of CD4+ T cells per microliter of blood was assessed via flow cytometry. In all panels, each RM is represented by a different symbol and color. Baseline (BL) is the average of data collected at weeks 6, 4, 2, and 0 p.i.. Inoculation with SIVmac239 at week 0 p.i. is indicated by a purple dashed arrow. Inoculation with P. fragile at week 12 p.i. is indicated by a blue dashed arrow. Antiretroviral therapy (ART) was initiated at week 8 p.i., indicated by the dark-grey bar. Antimalarial treatment occurred throughout week 14 p.i., indicated by the light-grey bar. Statistical significance between all timepoints was calculated using a mixed-effects analysis with the Geisser–Greenhouse correction and a Tukey’s multiple-comparison test, with individual variances computed for each comparison. Significant multiplicity-adjusted p values are shown above horizontal black bars.

