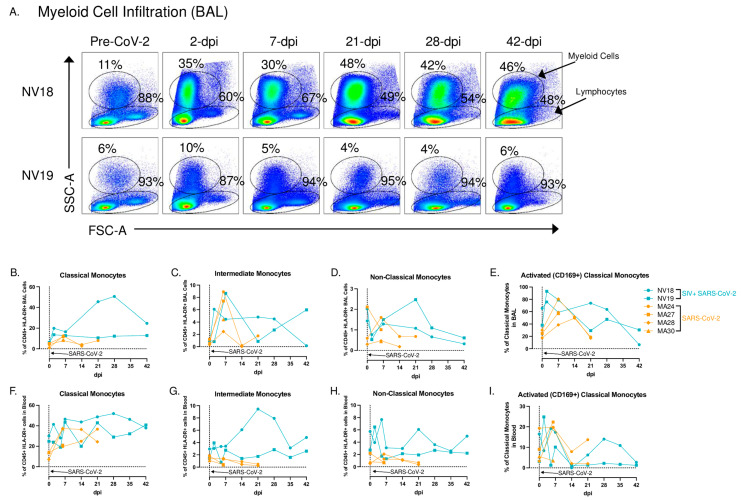
Figure 4.
Monocyte/macrophage kinetics in BAL and blood following SARS-CoV-2 infection of SIV+ and SIV-naïve PTMs. (A) Representative flow cytometry dot plots of pulmonary-infiltrating myeloid cells and lymphocytes in the lungs of two SIV+ PTMs before and 2, 7, 21, 28, and 42 days after SARS-CoV-2 exposure. Gated on time>live>single cells>CD45+>SSC-A vs FSC-A. (B–I). Frequencies of classical (CD45+, HLA-DR+, CD14+, CD16−) (B,F) intermediate (CD45+, HLA-DR+, CD14+, CD16+) (C,G), and non-classical monocytes (CD45+, HLA-DR+, CD14−, CD16+) (D,H) in BAL (B–D) and blood (F–H) before and after SARS-CoV-2 infection. Day 0 = day of SARS-CoV-2 infection. (E–I) activated classical monocytes (CD169+) in BAL and blood. (B–I) SIVmac239/SARS-CoV-2-infected PTMs (blue), and SARS-CoV-2-only-infected PTMs (orange).

