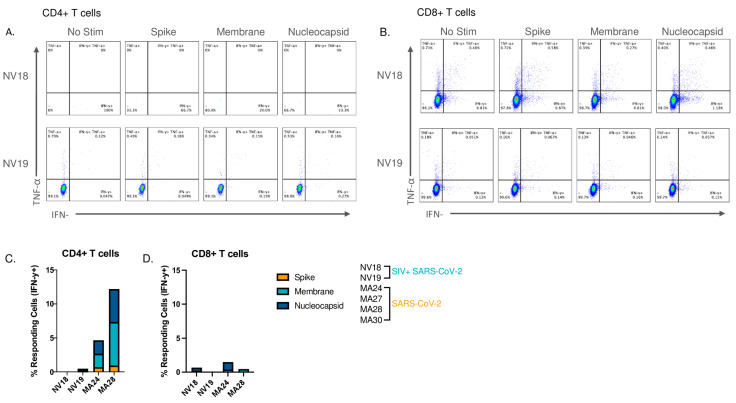
Figure 6.
SARS-CoV-2 specific T-cell responses were undetectable in the lung 21 days post-infection. (A,B). Flow cytometry dot plots demonstrating the IFN-y and TNF-a response of CD4+ (A) and CD8+ (B) T cells to overnight SARS-CoV-2 peptide (spike, membrane, and nucleocapsid) stimulation. No Stim = cells incubated overnight without peptide stimulation. Note: NV18 exhibited virtually no detectable CD4+ T cells in BAL at the time of sampling; thus, the empty flow plot for CD4+ T-cell cytokine response to stimulation. (C,D). Comparison of IFN-γ-producing CD4+ (C) and CD8+ (D) T cells in response to SARS-CoV-2 peptide stimulation in the coinfected and SIV-naïve animals. Background subtraction was applied to all values.

