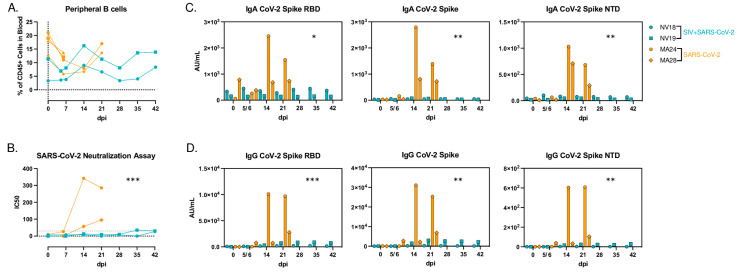
Figure 7.
Humoral immune response to SARS-CoV-2 infection. (A) B cell frequencies in PBMCs after SARS-CoV-2 infection. (B) Live SARS-CoV-2 neutralization in serum using a PRMNT assay with Vero TMPRSS2 cells. (B,C) Meso Scale analysis of IgA- (C) and IgG- (D) binding antibodies to SARS-CoV-2 spike receptor binding domain (RBD), spike glycoprotein 1 and 2 (S1&S2), and spike N-terminal domain (NTD). Linear mixed-effects model was used to determine significance of the interaction of time (dpi) and group (Coinfected vs SARS-CoV-2 only). * p < 0.05, ** p < 0.01; *** p < 0.001.

