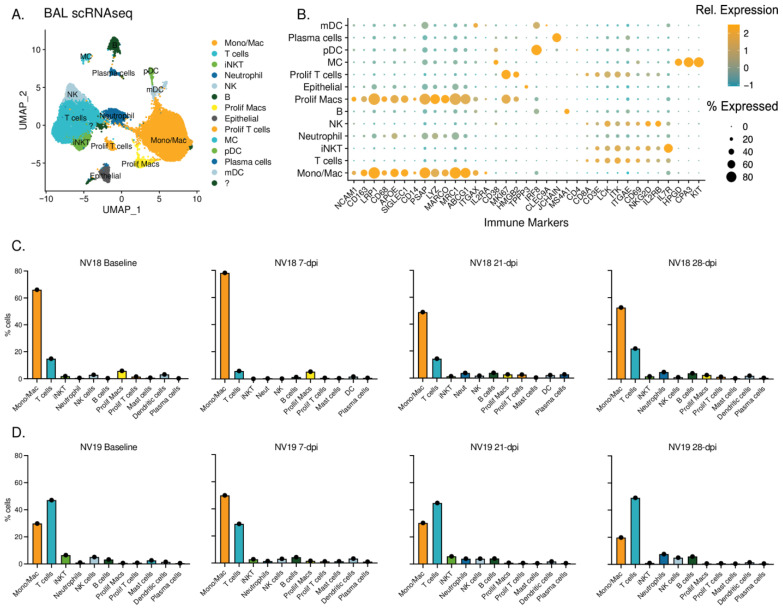
Figure 8.
Single-cell classification and dynamics of bronchoalveolar lavage cell populations during SIV/SARS-CoV-2 coinfection. (A) UMAP plots illustrating scRNAseq data obtained from BAL sampling of PTMs (NV18 and NV19) coinfected with SIV and SARS-CoV-2. (B) Gene markers utilized for cell type identification. Dot color represents relative gene expression (Rel. Expression), while dot size indicates the proportion of cells expressing the gene (% Expression). Refer to supplemental Figure S6 for additional genes used. (C,D) Immune cell dynamics in BAL during SARS-CoV-2 infection for the more immunocomprimised animal, NV18 (C), and NV19 (D). The baseline (BL) sample was collected prior to SARS-CoV-2 exposure at 48 weeks post-SIV infection. MC = mast cells, pDC = plasmacytoid dendritic cells, mDC = myeloid dendritic cells, NK = natural killer cells.

