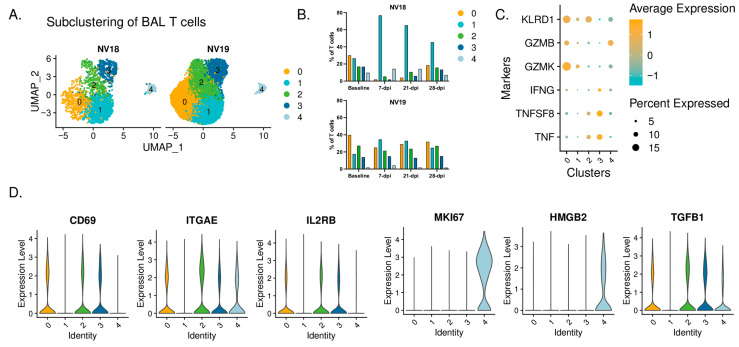
Figure 10.
T-cell dynamics. (A) UMAP plots showing subclustered T cells. (B) T-cell dynamics during SARS-CoV-2 infection. (C) Dot plot depicting proinflammatory cytokine and cytotoxic marker expression by cluster. (D) Violin plots depicting gene expression of T-cell markers in Seurat-derived T-cell clusters.

