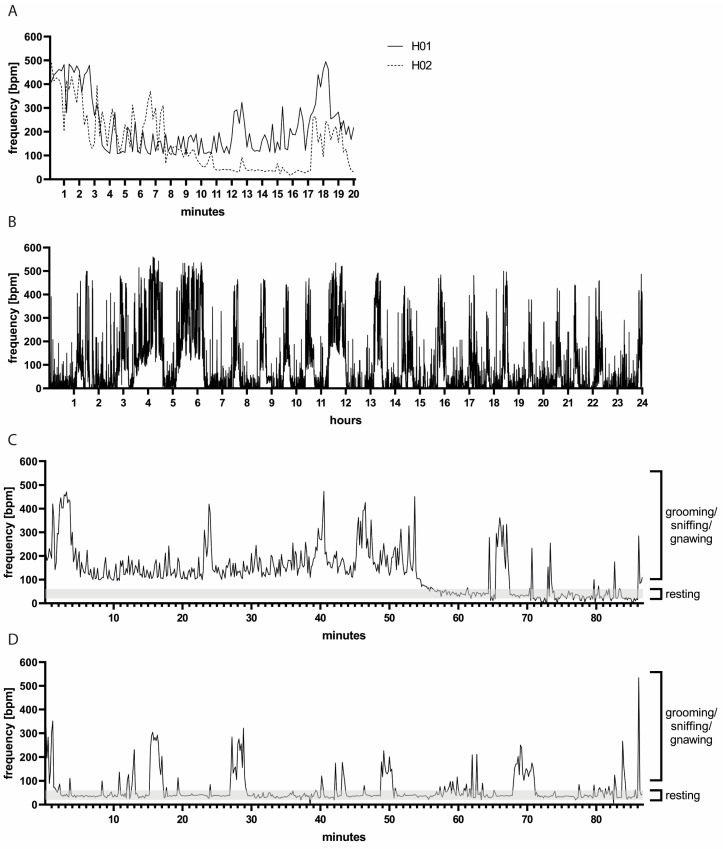
Figure 1.
(A) Representative bf measurements of two hamsters over 20 min. Note the variation between hamsters H01 and H02. (B) Representative bf measurements of hamster H01 during 24 h. Note the variation in bf over time. (C,D) Measurements of bf accompanied by video recording: representative measurements of hamsters H01 and H02, respectively. High bf values coincided with hamster movements, such as grooming, sniffing or gnawing, while lower bf values were observed during resting periods. Note the variation between the two animals H01 in (C) and H02 in (D) representative of individual as well as day-to-day variations.

