. 2024 Jul 26;12:RP91114. doi: 10.7554/eLife.91114

Figure 3. SPAG7-deficiency dampens skeletal muscle function and mitochondrial oxidative capacity.

(A) Distance run until exhaustion for WT vs SPAG7 KO animals in treadmill endurance test. n=7. Significance was assessed by Welch’s two sample t-test. (B) Max VO2 reached during treadmill endurance. n=6. Significance was assessed by Welch’s two sample t-test. (C) In vivo gastrocnemius/soleus complex muscle max force generation. n=6. Significance was assessed by Welch’s two sample t-test. (D) Cross sectional area of myosin heavy chain 2a-expressing fiber in gastrocnemius muscle. n=7. Significance was assessed by Welch’s two sample t-test. (E) Triglyceride content of gastrocnemius muscle. n=6. Significance was assessed by Welch’s two sample t-test. (F) Histological sections of gastrocnemius muscle stained with hematoxylin and eosin. Scale bars = 300 µm. (G) Histological sections of gastrocnemius muscle labeled with antibodies against lectin (red), CD31 (green), and DAPI (blue). Scale bars = 200 µm. (H) Quantification of CD31 +and lectin +capillaries per muscle fiber in gastrocnemius muscle. N=6. (I) Histological sections of gastrocnemius muscle stained for succinate dehydrogenase B activity. Scale bars = 600 µm. (J) Citrate synthase activity of gastrocnemius muscle. n=7. Significance was assessed by Welch’s two sample t-test. (K) Volcano plot of differentially expressed genes in female WT vs SPAG7 KO gastrocnemius muscle following RNAseq. N=7. (L) Gene ontology enrichment pathway analysis of differentially expressed genes in female WT vs SPAG7 KO gastrocnemius muscle following RNAseq. n=7. * p<0.05, ** p<0.01, *** p<0.001, **** p<0.0001.

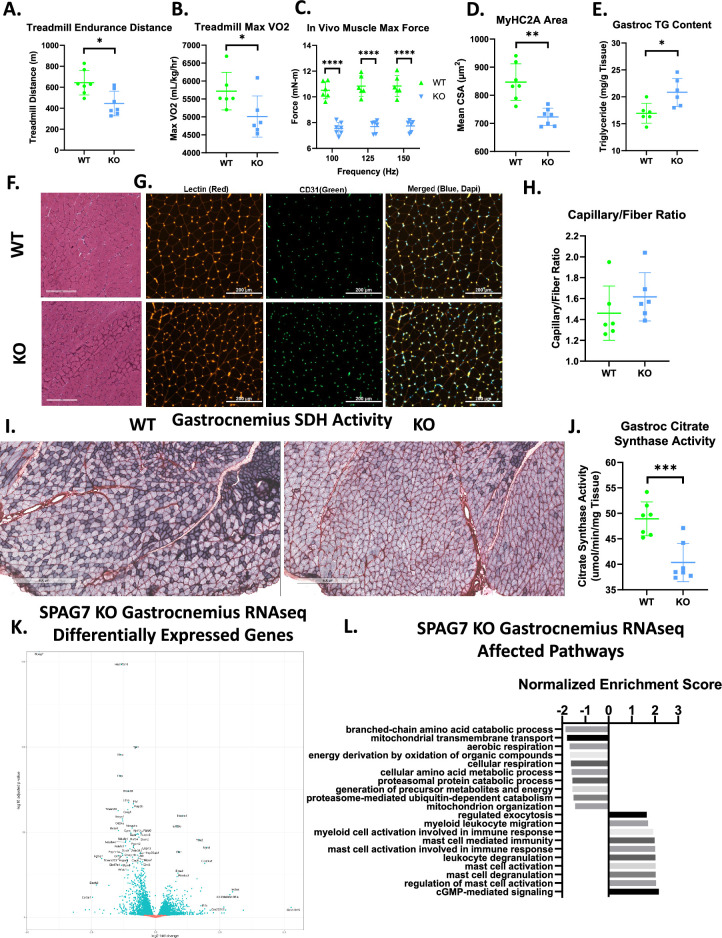
Figure 3.

Figure 3—figure supplement 1. SPAG7-deficient muscle fiber staining.

Figure 3—figure supplement 1.

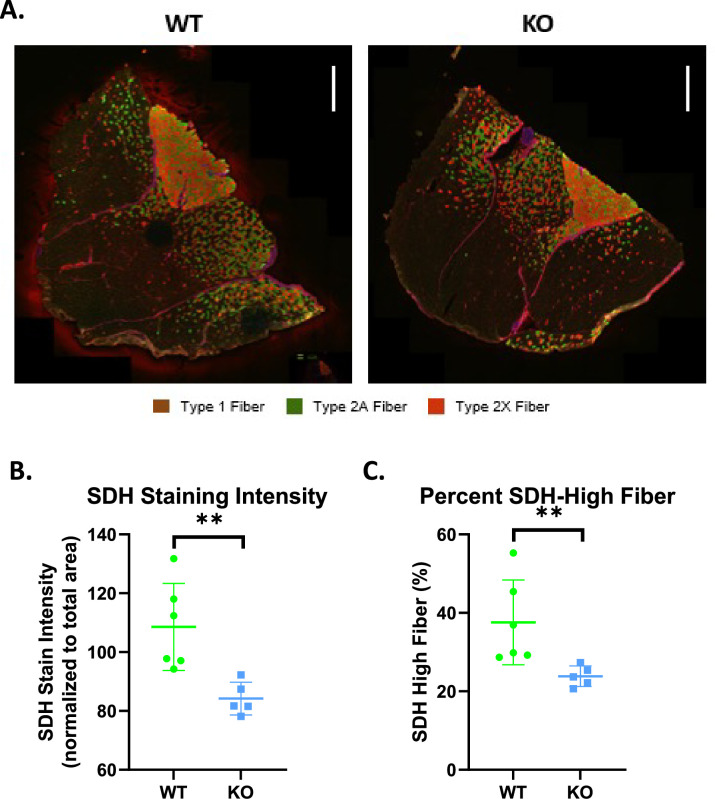
(A) Fluorescent microscopy images of WT and SPAG7-deficient gastrocnemius/soleus muscle complex stained for Type 1 Fiber (Orange), Type 2 A Fiber (Green), and Type 2 X Fiber (Red). Scale bars represent 1 mm. (B) SDH staining intensity in WT vs. SPAG7-deficient gastrocnemius muscle. Significance was assessed by Welch’s two sample t-test. (C) Percent SDH-High staining fiber in WT vs. SPAG7-deficient gastrocnemius muscle. Significance was assessed by Welch’s two sample t-test. ** p<0.01.
Figure 3—figure supplement 2. SPAG7-deficient skeletal muscle transcriptomics.

Figure 3—figure supplement 2.

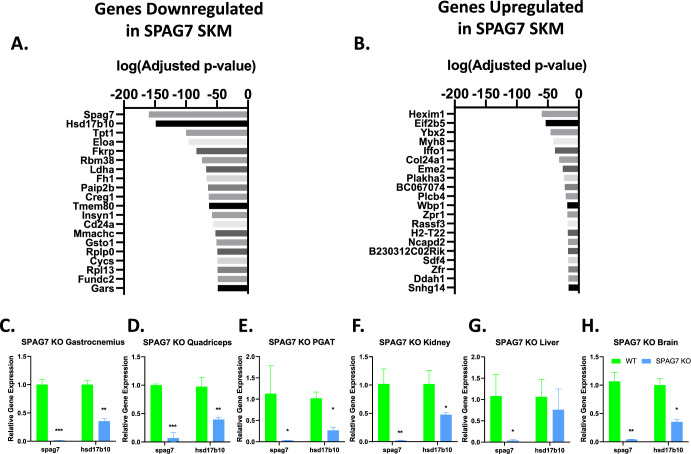
(A) Top 20 genes downregulated in SPAG7 KO gastrocnemius muscle vs WT by log(adjusted p-value). N=7. (B) Top 20 genes upregulated in SPAG7 KO gastrocnemius muscle vs WT by log(adjusted p-value). N=7. (C) Gene expression by qPCR of Spag7 and Hsd17b10 in SPAG7 KO gastrocnemius muscle. n=7. Significance was assessed by Welch’s two sample t-test. (D) Gene expression by qPCR of Spag7 and Hsd17b10 in SPAG7 KO quadriceps muscle. n=7. Significance was assessed by Welch’s two sample t-test. (E) Gene expression by qPCR of Spag7 and Hsd17b10 in SPAG7 KO in perigonadal adipose tissue. n=7. Significance was assessed by Welch’s two sample t-test. (F) Gene expression by qPCR of Spag7 and Hsd17b10 in SPAG7 KO kidney. n=7. Significance was assessed by Welch’s two sample t-test. (G) Gene expression by qPCR of Spag7 and Hsd17b10 in SPAG7 KO liver. n=7. Significance was assessed by Welch’s two sample t-test. (H) Gene expression by qPCR of pag7 and Hsd17b10 in SPAG7 KO brain. n=7. Significance was assessed by Welch’s two sample t-test. * p<0.05, ** p<0.01, *** p<0.001.