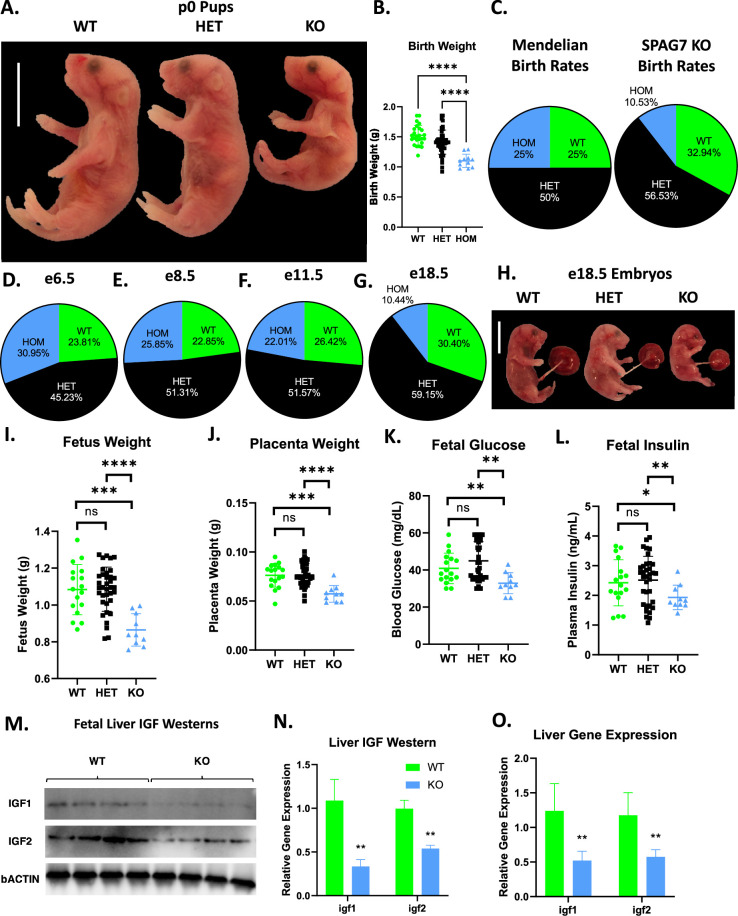
Figure 5. SPAG7-deficiency induces intrauterine growth restriction.
(A) Gross morphology of WT, SPAG7 KO Heterozygous, and SPAG7 KO Homozygous pups at p0. Scale bars represent 10 mm. (B) Birth weights of WT, SPAG7 KO Heterozygous, and SPAG7 KO Homozygous pups. Number of WT pups = 25. Number of HET pups = 45. Number of HOM pups = 11. Significance was assessed by one-way ANOVA and Tukey HSD. (C) Mendelian birth genotyping rates expected from Heterozygous x Heterozygous breeding (left), and birth genotyping rates observed from SPAG7 KO Heterozygous x Heterozygous breeding (right). Number of dams = 29. (D) Embryo genotyping rates at e6.5 from SPAG7 KO Heterozygous x Heterozygous breeding. Number of dams = 6. (E) Embryo genotyping rates at e8.5 from SPAG7 KO Heterozygous x Heterozygous breeding. Number of dams = 6. (F) Embryo genotyping rates at e11.5 from SPAG7 KO Heterozygous x Heterozygous breeding. Number of dams = 6. (G) Embryo genotyping rates at e18.5 from SPAG7 KO Heterozygous x Heterozygous breeding. Number of dams = 6. (H) Gross morphology of WT, HET, and SPAG7 KO embryos at e18.5. Scale bars represent 10 mm. (I) Fetus weights at e18.5, comparing WT and SPAG7 KO embryos. n=10. Significance was assessed by one-way ANOVA and Tukey HSD. (J) Placenta weights at e18.5, comparing WT and SPAG7 KO embryos. n=10. Significance was assessed by one-way ANOVA and Tukey HSD. (K) Fetal blood glucose levels at e18.5, comparing WT and SPAG7 KO embryos. n=10. Significance was assessed by one-way ANOVA and Tukey HSD. (L) Fetal plasma insulin levels at e18.5, comparing WT and SPAG7 KO embryos. n=10. Significance was assessed by one-way ANOVA and Tukey HSD. (M) Western blots for bACTIN, IGF1, and IGF2 in WT and SPAG7 fetal liver at e18.5. n=4. (N) Quantification of western blots in Figure 6M. n=4. Significance was assessed by Welch’s two sample t-test. (O) Gene expression levels of igf1 and igf2 in fetal liver at e18.5. n=6. Significance was assessed by Welch’s two sample t-test. * p<0.05, ** p<0.01, *** p<0.001, **** p<0.0001.

