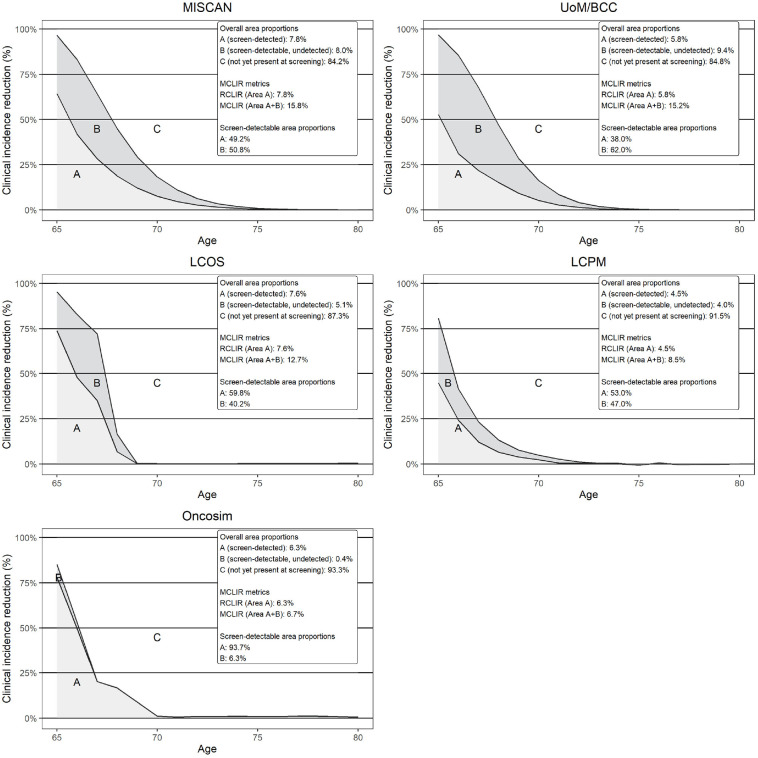
Figure 1.
Fifteen-year model-specific lung cancer incidence reductions under different assumptions.
The y-axis refers to the observed reduction in the incidence of clinically detected lung cancers compared with no screening at each age across the different modeled scenarios. The top part of the legend (overall area proportions) refers to the proportion of lung cancers occurring over ages 65 to 80 y in each of the areas A, B, and C, which represent cancers occurring over ages 65 to 80 y. Area A is derived by comparing the cancer incidence in scenarios RealSensPerfectTreat /RealSensRealTreat to scenario NoScreen and forms the RCLIR. It shows the proportion of cancers occurring over ages 65 to 80 y that are detected when assuming realistic sensitivity estimates. Area B is derived by comparing the cancer incidence in scenario PerfectSensTreat to scenarios RealSensPerfectTreat/RealSensRealTreat to NoScreen. It shows the proportion of cancers that are present at the moment of screening but are not detected due to imperfect sensitivity. Areas A and B combined form the MCLIR. Finally, area C represents the proportion of cancers that will be detected clinically between ages 65 to 80 y but that are not yet present at the moment of screening. For example, in MISCAN, 7.8% (area A) of cancers occurring over ages 65 to 80 y are detected at the moment of screening, while 8.0% (area B) is missed due to imperfect sensitivity and 84.2% (area C) is not yet detectable at the moment of screening. Consequently, MISCAN’s RCLIR is 7.8% and its MCLIR 15.8%. Of the cancers that are detectable at the moment of screening, MISCAN detects 49.2% (area A) but misses 50.8% (area B) due to imperfect sensitivity. The bottom part of the legend refers to the distribution of areas A and B when the cancers detectable at the moment of screening are considered as the denominator (areas A+B).

