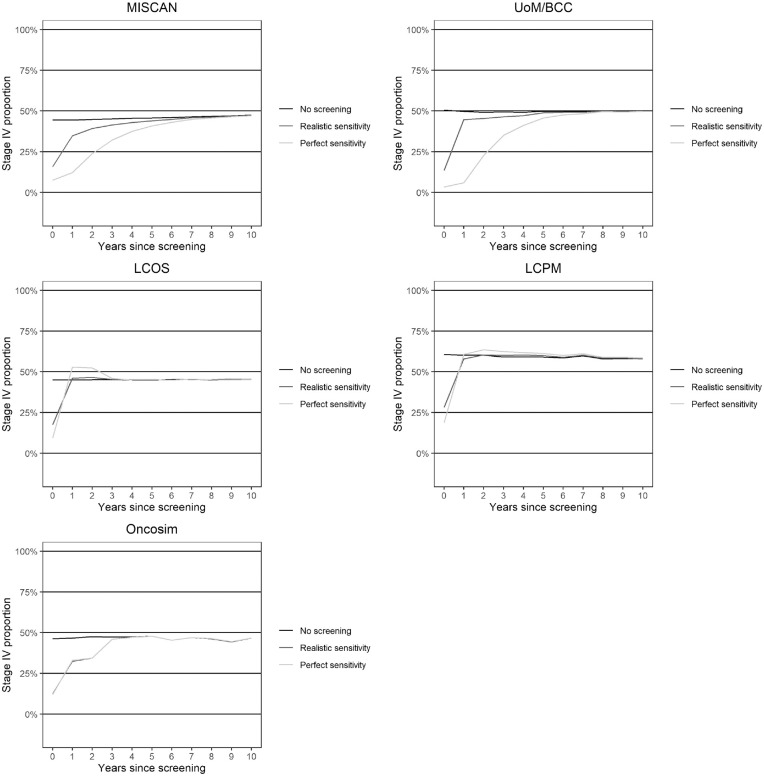
Figure 2.
Effect of sensitivity on the occurrence of stage IV cancers postscreening.
The figure notes the proportion of clinically detected lung cancers occurring in stage IV (on the y-axis) in each year postscreening under the different scenarios. The line “No screening” represents the proportion of stage IV cancers in scenario NoScreen. The line “Realistic sensitivity” represents the proportion of stage IV cancers in scenarios RealSensPerfectTreat and RealSensRealTreat. Finally, the line “Perfect sensitivity” represents the proportion of stage IV cancers in scenario PerfectSensTreat.

