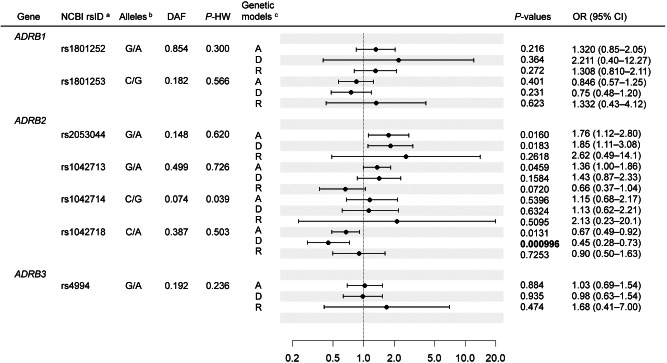
Fig. 1. Association analyses in the FDG-PET/CT population.
aIdentifiers in the Single Nucleotide Polymorphism database at the National Center for Biotechnology Information are shown. bAncestral allele/derived allele of each SNP is indicated. cThe tested genetic models are as follows: A additive model, D dominant model, R recessive model, DAF derived allele frequency, P-HW p values for Hardy–Weinberg test, OR odds ratio, CI confidence interval; A binary variable representing the presence (1) or absence (0) of active BAT was used as the dependent variable. As independent variables other than genotypes, sex (0 = female, 1 = male), age, the interaction term of age and sex (female: 0*age, male: 1*age), and a dummy variable representing the test month (0 = December and March, 1 = January and February) were included. For each SNP, three genetic models (additive, dominant, and recessive) of the derived allele were tested. The black dots and horizontal bars represent the ORs of each model and their 95% CIs, respectively.

