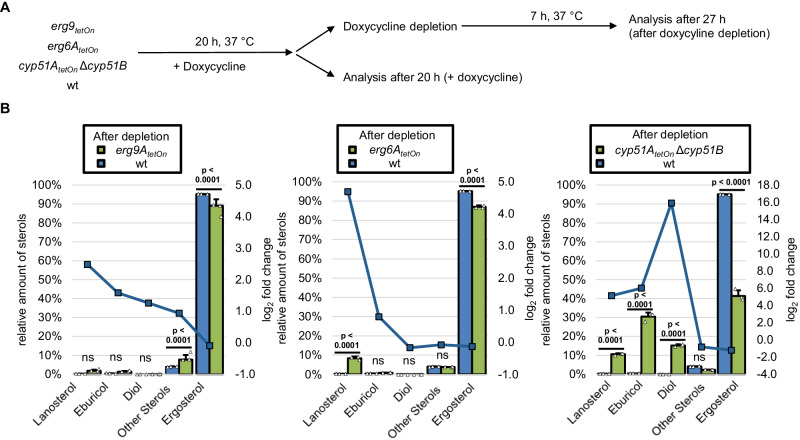
Fig. 4. Sterol profiles of squalene synthase-, sterol C24-methyltransferase- and sterol C14-demethylase-depleted A. fumigatus hyphae.
A Conidia of wild type (wt) and the indicated mutants were inoculated in a Sabouraud liquid medium. Cultures with the conditional sterol C24-methyltransferase mutant (erg6AtetOn), the conditional squalene synthase (erg9tetOn), and the respective wild-type control (wt) were supplemented with 2 µg ml−1 doxycycline. Cultures with the conditional sterol C14-demethylase mutant (cyp51AtetOn Δcyp51B) and the respective wild-type control (wt) were supplemented with 3 µg ml−1 doxycycline. After 20 h incubation in a rotary shake at 37 °C, mycelium was either directly harvested or washed with and transferred into Sabouraud liquid medium without doxycycline, incubated in a rotary shake at 37 °C for another 7 h, and then harvested. For each condition, three biological replicates were cultured. B The sterol patterns of the harvested mycelia were analyzed by gas chromatography-mass spectrometry (GC-MS). The column graphs show the relative amounts (percentage of total sterol, left y-axis) of the indicated sterols for the indicated strains before and after doxycycline depletion. The data points with the square symbols indicate the log2-fold change (right y-axis) in the amount of the respective sterol of the pairwise comparison of the conditions shown in the individual graphs. The log2-fold change data points were connected by lines for a better visual illustration of the changes in the profiles. Each column bar represents the mean of three replicates (data points) per condition, the error bars indicate standard deviations. Data were representative of five (erg6AtetOn; cyp51AtetOn Δcyp51B) and one (erg9tetOn) experiments conducted under similar conditions. Statistical significance was set at p < 0.05, and calculated with a two-way ANOVA with Tukey’s multiple comparison test. p values are indicated in the graphs; ns not significant. Further pairwise comparisons of the results of this experiment are shown in Supplementary Fig. 4. Source data are provided as a Source Data file.

