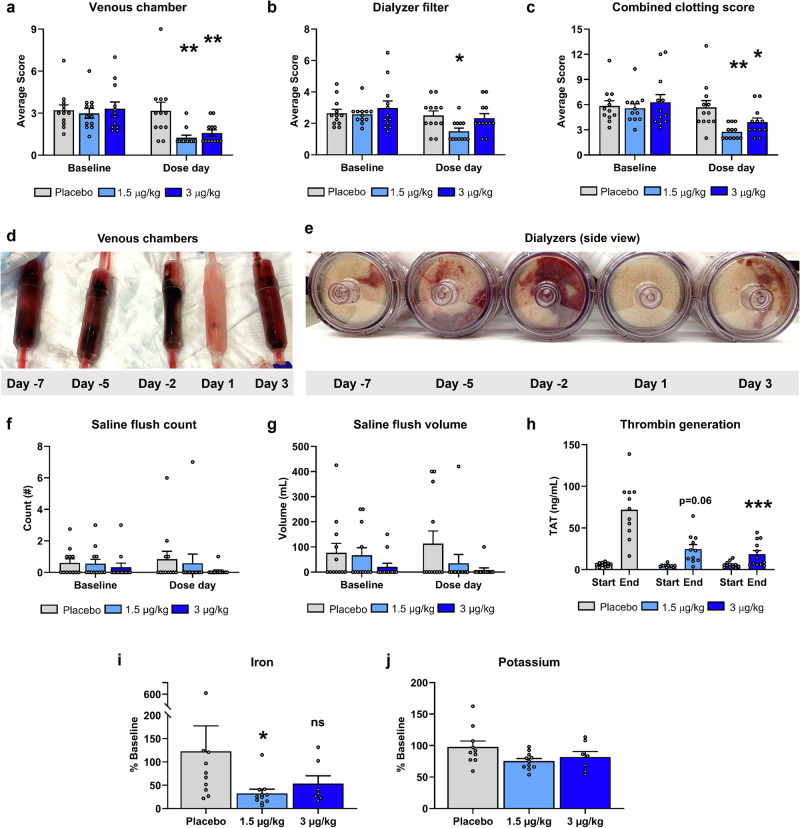
Fig. 2. Circuit clotting, thrombin generation, and blood entrapment.
Severity of clotting within the circuit at the end of hemodialysis was evaluated in the venous chamber and dialyzer filter for each session using a numeric visual score to generate a mean clotting score at baseline (non-dosing days −7, −5, −2, 3) and dose day (day 1) for each patient. The mean clotting scores from the venous chamber (a), dialyzer filter (b), and the combined score of both (c) are presented by treatment group (n = 12 patients for placebo [gray bars], n = 12 for 1.5 µg/kg [light blue bars], and n = 12 for 3 µg/kg [dark blue bars] groups). Data represent means ± SEM; *p < 0.05 and **p < 0.01 comparing change from baseline scores vs placebo. In (d, e), representative photographs of a series of venous chambers and side view of dialyzer filters from two separate patients that received AB002 on day 1 are shown. The number (f) and total volume (g) of hemodialysis circuit saline flushes required to maintain circuit patency on non-dosing days were recorded to generate an average value at baseline and were compared to the means for the day of dosing for each treatment group. Thrombin-antithrombin (TAT) complexes (h) were measured in patient plasma samples at the start and end of hemodialysis to examine the effect of AB002 on systemic thrombin generation. n = 11 for placebo, n = 11 for 1.5 µg/kg, and n = 12 for 3 µg/kg; data represent means ± SEM, ***p < 0.001 comparing change vs placebo. AB002 reduced iron (i) and potassium (j) retained within the hemodialysis cartridge due to blood clotting on study day 1 compared to placebo. n = 10 for placebo, n = 11 for 1.5 µg/kg, and n = 7 for 3 µg/kg, data represent means ± SEM, *p < 0.05 vs placebo. Exact p-values are provided in Supplementary Data 1.

