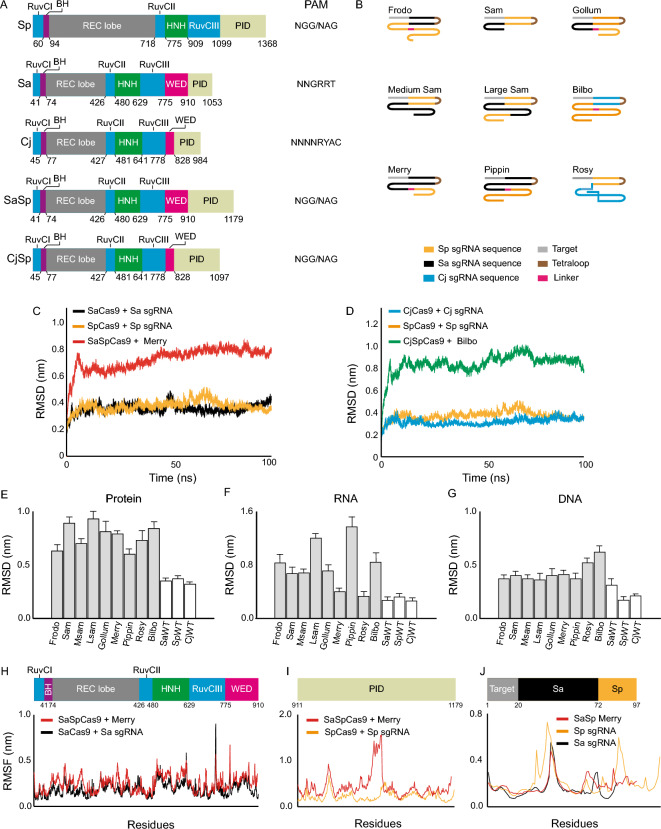
Figure 3.
Molecular dynamics simulations of Cas9 hybrids. (A) Domain organization of the Sp, Sa, and Cj Cas9 as well as the hybrids tested here. The PAM sequence is either the reported ones or, for the hybrids, the expected PAM. The numbers indicate the position of amino acids at domain boundaries (BH bridge helix, WED wedge domain, PID PAM interacting domain). (B) Schematic representation of the sgRNA hybrids tested here. (C) RMSD of SpCas9, SaCas9, and SaSpCas9 with their specific sgRNAs during 100 ns. The SaSp sgRNA presented is Merry. (D) RMSD of SpCas9, CjCas9, and CjSpCas9 with their specific sgRNAs over a simulation of 100 ns. The CjSp sgRNA presented is Bilbo. (E–G) Average RMSD for the protein (E), sgRNA (F), and DNA (G) in all 12 systems modeled. (H) RMSF of SaCas9 with its sgRNA (black) and SaSpCas9 in combination with Merry (red) for the N-terminal common to both proteins. (I) RMSF of the PID of SpCas9 with its sgRNA (yellow) and SaSpCas9 in combination with Merry (red). (J) RMSF of SpCas9 sgRNA (yellow), SaCas9 sgRNA (black) and SaSpCas9 sgRNA (red).

