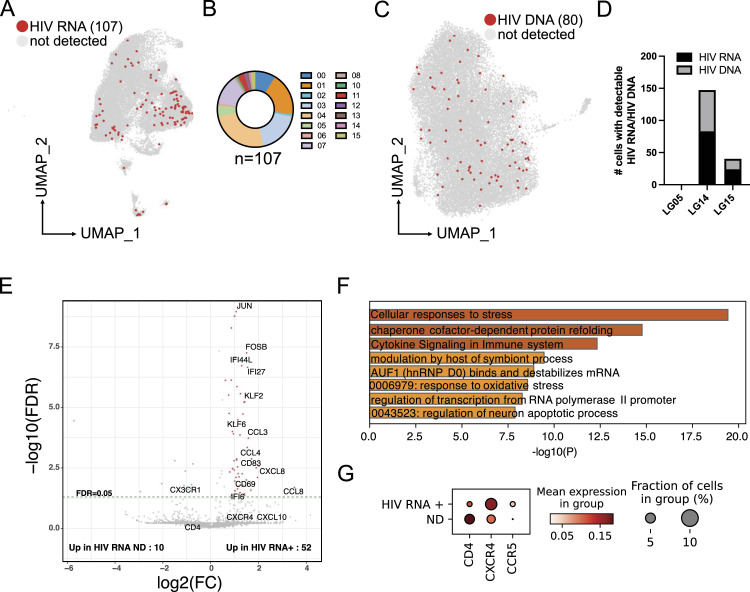
Figure 4. Differential gene expression of HIV-infected microglial cells.
(A) Uniform Manifold Approximation and Projection for Dimension Reduction presentation of the single-cell RNA-seq dataset highlights cells with detected HIV RNA. (B) Pie chart showing the number of cells with detectable HIV RNA per cluster. (C) Uniform Manifold Approximation and Projection of single-cell ATAC-seq depicting cells with detectable integrated HIV DNA into the host’s genome in regions of open chromatin. (D) Number of cells with detectable HIV RNA and HIV DNA per Last Gift participant. (E) Volcano plot showing differential gene expression between HIV RNA+ cells and random cells with no detectable HIV transcripts. (F) Gene ontology analysis of expression of genes up-regulated in microglia with detectable HIV RNA. (G) Dot plot depicting the fraction of cells expressing the genes and the mean expression level in cells with detectable (HIV RNA+) and non-detectable (ND) HIV RNA.
Source data are available for this figure.

