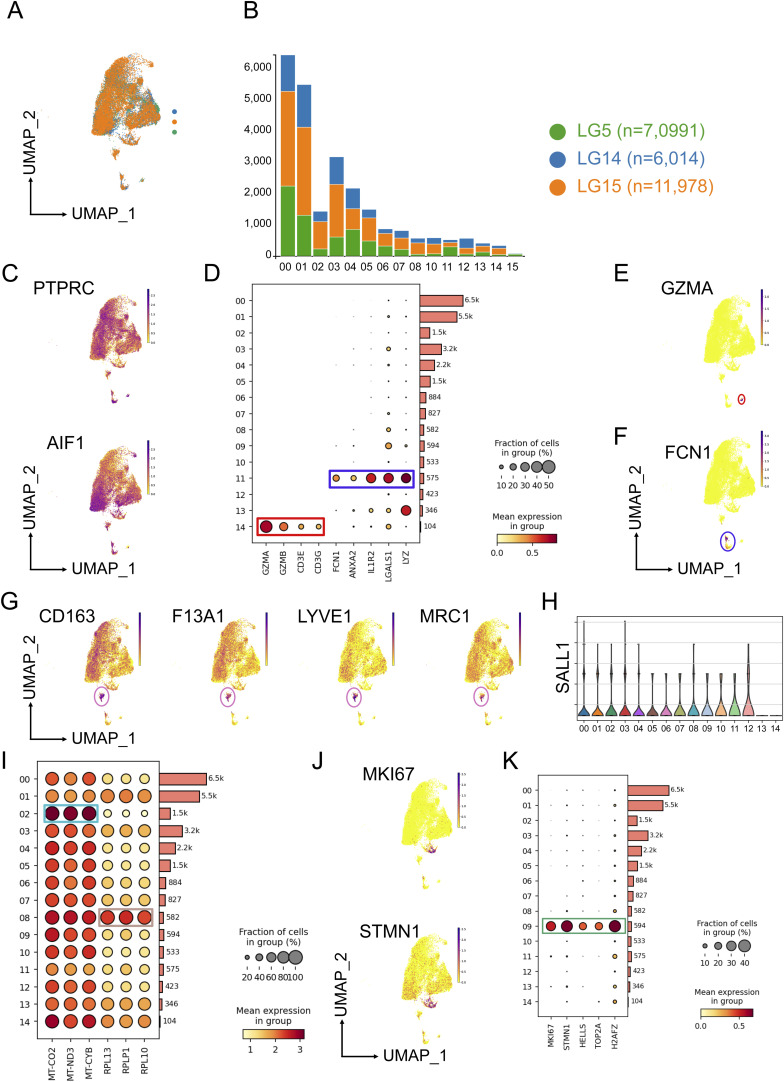
Figure S2. Single-cell RNA-seq of CD45+ cells.
(A) Uniform Manifold Approximation and Projection plot of 25,091 CD45+ cells depicting the proportion of sequenced cells for LG5, LG14, and LG15. (B) Stacked bar plot showing the number of CD45+ cells per Last Gift participant related to clusters. (C) Feature plots showing the expression of PTPRC encoding CD45 and AIF1 encoding IBA1. (D) Dot plot highlighting marker genes for lymphocytes (Cluster 14) and peripheral myeloid cells (Cluster 11). The size of the circles shows the fraction of cells expressing the genes, and the color scale provides the mean expression level per group. (E, F) Feature plots showing the expression of GZMA and FCN1 for clusters 14 and 11, respectively. (G) Feature plots depicting marker genes (CD163, F13A1, LYVE1, and MRC1) for perivascular macrophages. (H) Violin showing the gene expression of SALL1 with no detectable expression of SALL1 in the perivascular macrophage Cluster 13. (I) Dot plot showing the expression of mitochondrial genes. (J, K) Feature plots depicting marker genes of Cluster 09 (MKI67, STMN1) and dot plots of genes associated with proliferation.

