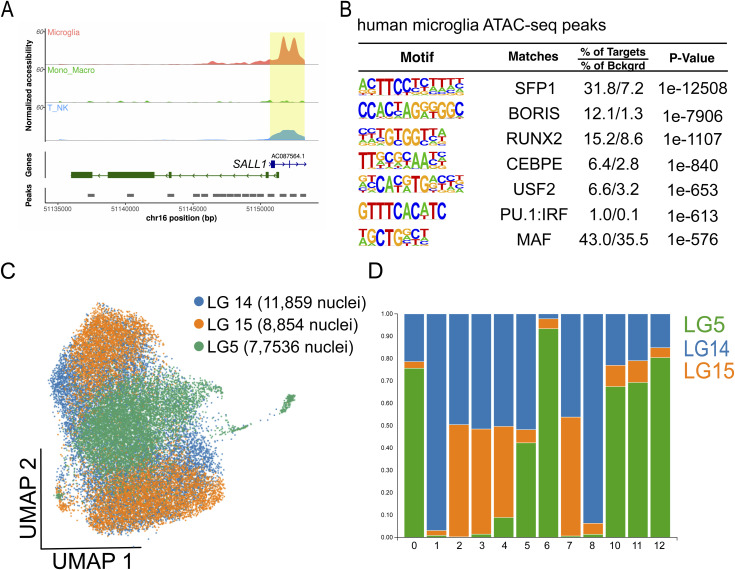
Figure S3. Single-cell ATAC-seq of CD45+ cells.
(A) Pseudobulk genome browser track at the SALL1 locus depicting the promoter region in yellow. (B) Enriched motifs of differential distal chromatin regions using the GC-matched genomic background in microglia. (C) Uniform Manifold Approximation and Projection plot of 27,229 CD45+ cells depicting the proportion of sequenced cells for LG5, LG14, and LG15. (D) Stacked bar plot showing the proportion of cells per Last Gift participant contributing to the identified clusters.

