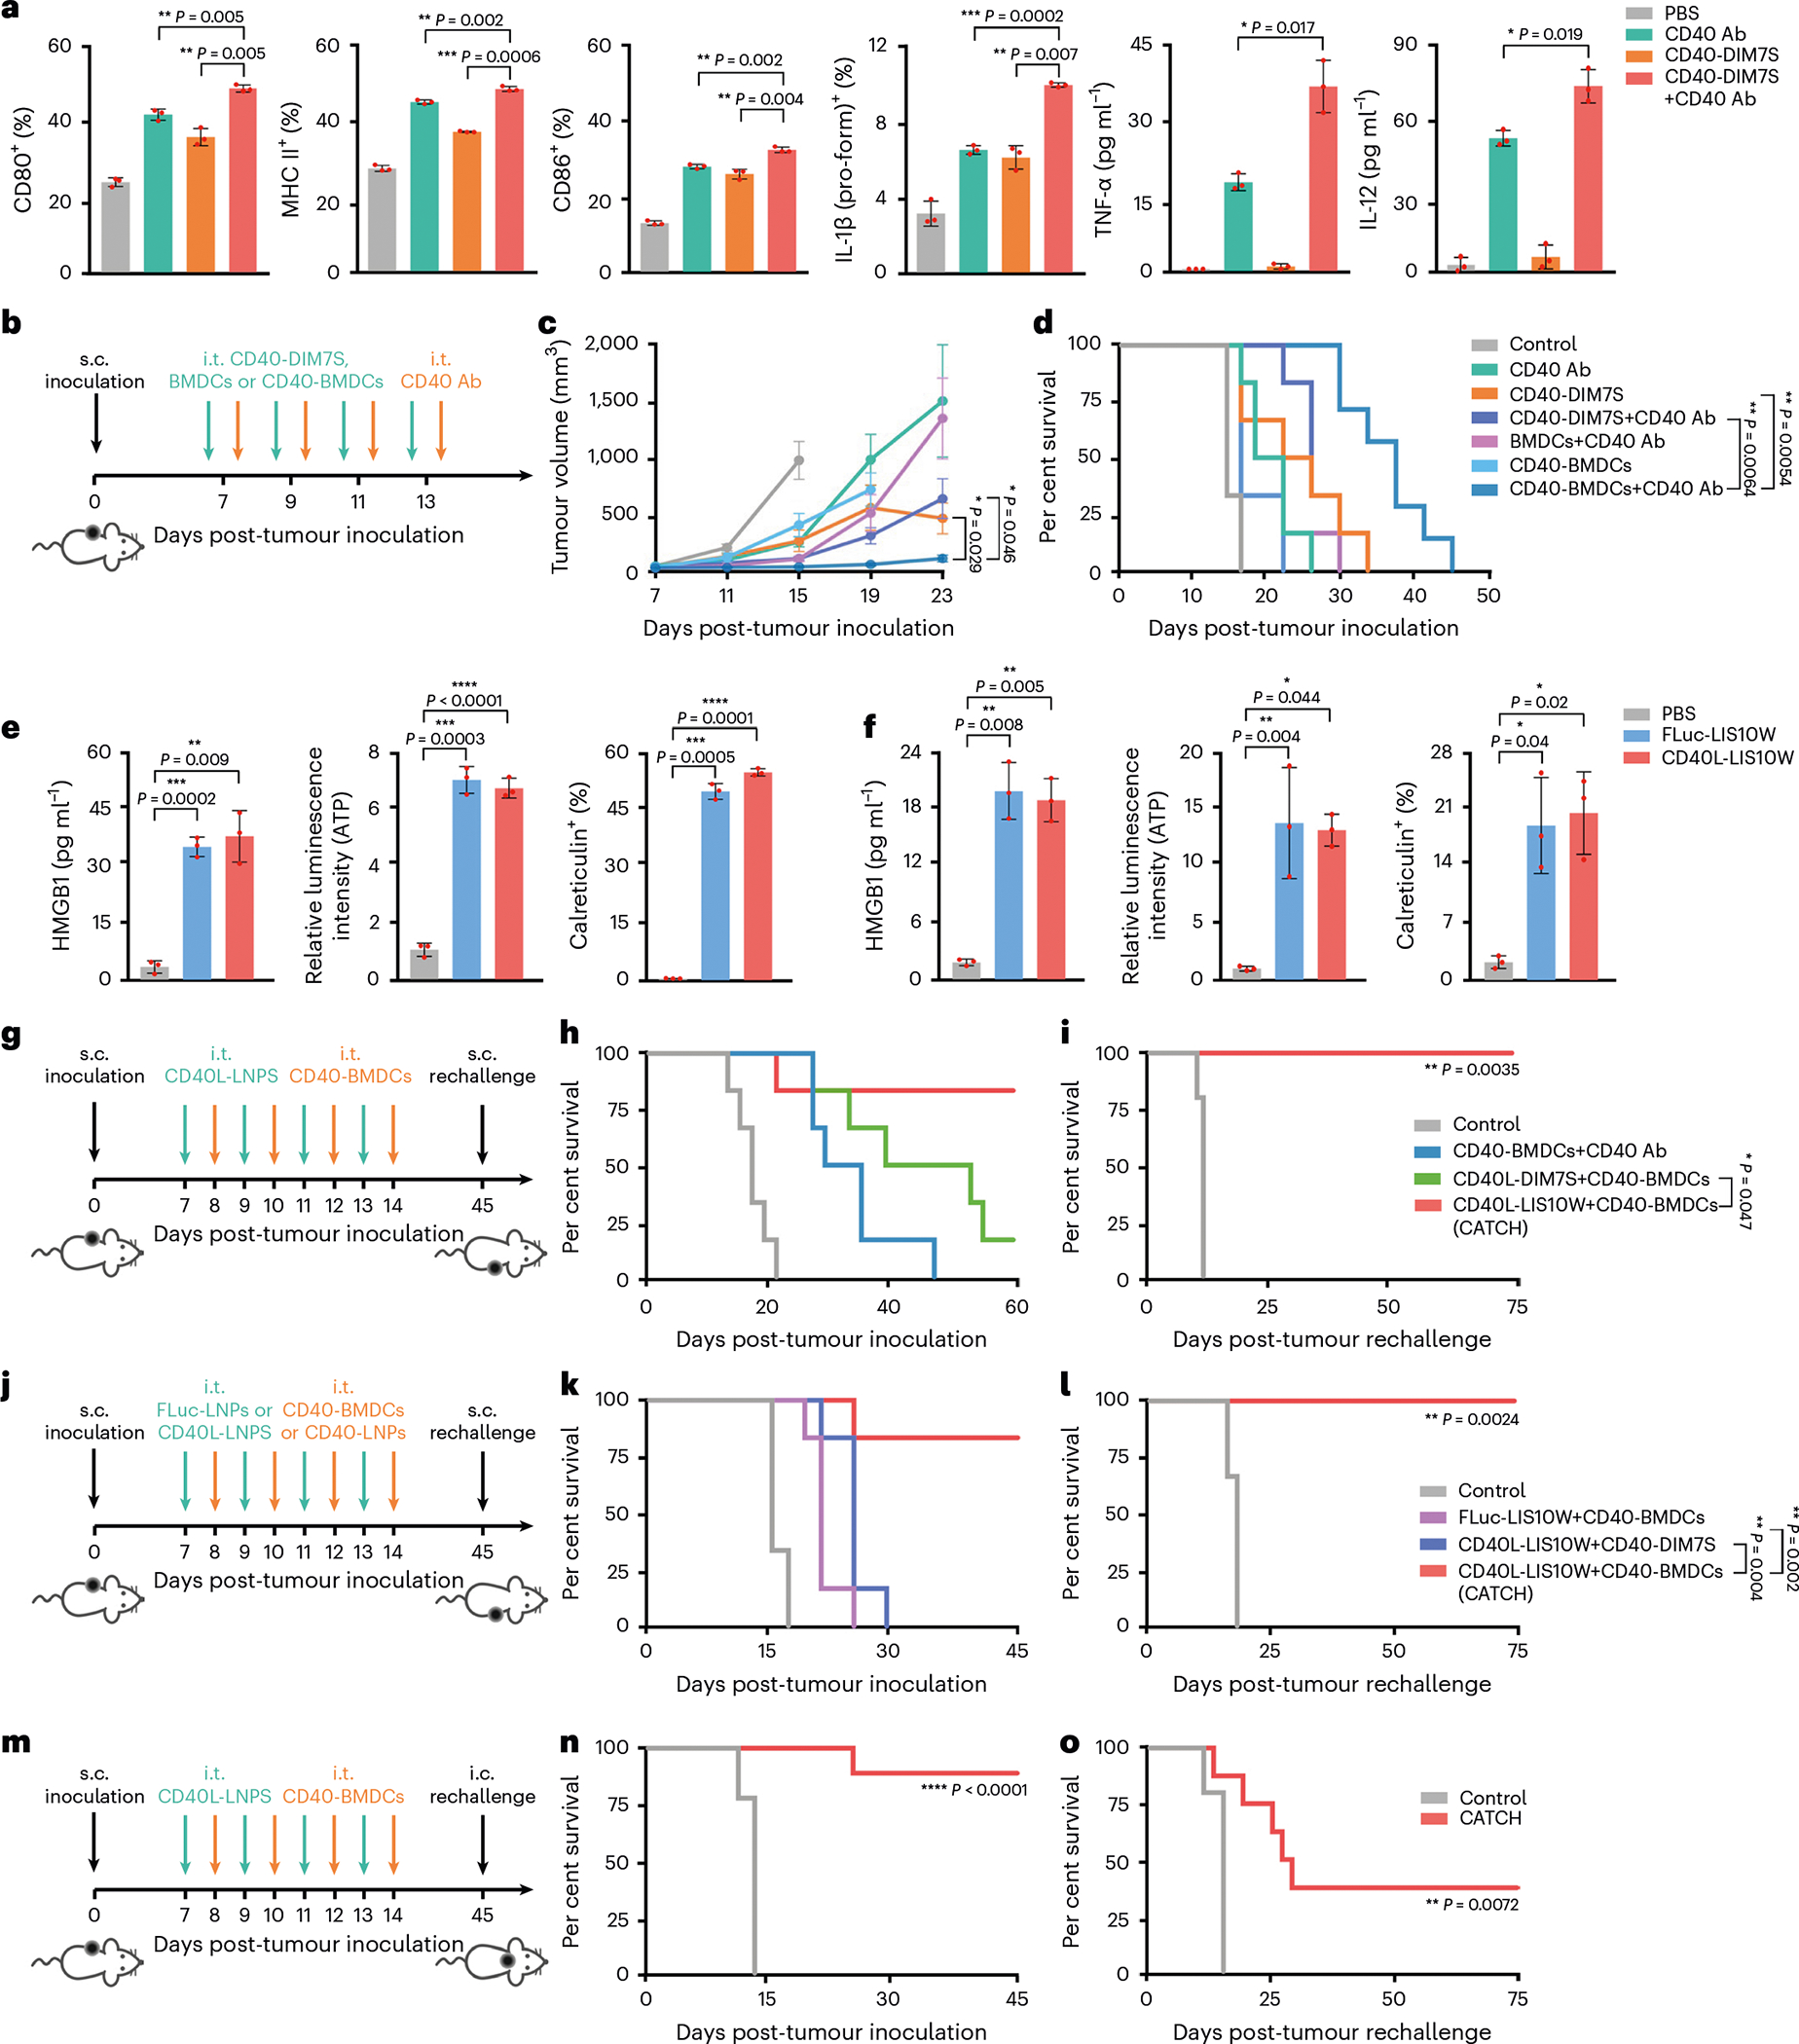
Fig. 3 |. DC activation, LNP-induced ICD and therapeutic effects on primary tumour and rechallenged tumour.

a, Expression of DC activation markers, including CD80, MHC II, CD86, IL-1β (pro-form), TNF-α and IL-12. b, Schematic of the treatment regimen in the B16F10 tumour model. c,d, Tumour volumes (c) and mouse survival (d) over time; n = 7 and 6 for CD40-BMDCs+CD40 Ab group and other groups, respectively. e,f, LNP-induced ICD markers in vitro (e) and in vivo (f), including extracellular HMGB1, extracellular ATP and cellular surface calreticulin. g, Schematic of the treatment regimen in the B16F10 tumour model. h, Mouse survival over time; n = 6. i, Survival of responder mice in the CATCH group post-s.c. tumour rechallenge; n = 5 and 6 for control group and CATCH group, respectively. j, Schematic of the treatment regimen in the B16F10 tumour model. k, Mouse survival over time; n = 6. l, Survival of responder mice in the CATCH group post-s.c. tumour rechallenge; n = 5 and 6 for the control group and CATCH group, respectively. m, Schematic of the treatment regimen in the B16F10-Luc2 tumour model. n, Mouse survival over time; n = 9. o, Survival of responder mice in the CATCH group post-i.c. tumour rechallenge; n = 5 and 8 for the control group and CATCH group, respectively. Data in a, e and f are from n = 3 biologically independent samples and are presented as mean ± s.d. Data in c are presented as mean ± standard error of the mean (s.e.m.). Statistical significance in a, c, e and f was analysed by the two-tailed Student’s t-test. Statistical significance in d, h, i, k, l, n and o was analysed by the log-rank (Mantel–Cox) test. *P < 0.05, **P < 0.01, ***P < 0.001, ****P < 0.0001.
