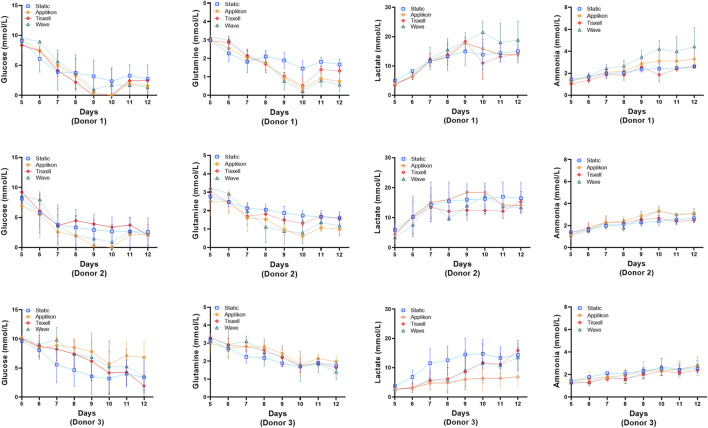
FIGURE 4.
Metabolite concentrations for the bioreactors. Levels of glucose, glutamine, lactate and ammonia were monitored daily. Glucose and glutamine consumption correlates well with the cell growth kinetics data. Lactate and ammonia production reflects the expansion cell growth trend. Lactate generation peaked from Day 7 followed by rapid decline of glucose and glutamine. Data are shown as mean ± SD.

