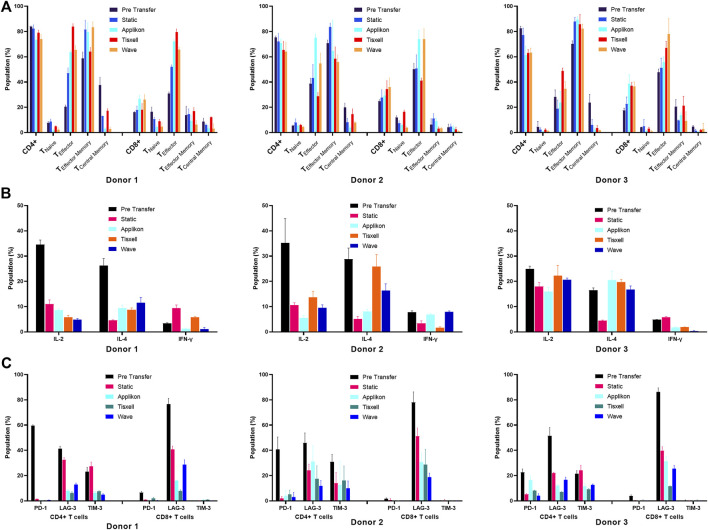
FIGURE 5.
Phenotype characterization of T-cells. (A) T-cell differentiation Surface markers, (B) Exhaustion markers and (C) Intracellular cytokines. T-cells subpopulations are analyzed pre-transfer and post-harvest on all culture systems. Cell populations are gated based on isotype controls. Cell quality was assessed based on CD4+ and CD8+ T-cell subpopulations. (A) CD4 to CD8 T-cell ratio was taken as a quality indicator of the final yields. Ratio (CD4:CD8) was higher (5:1) before transfer and reduced (2:1) as the expansion progressed. Expression profiles of the memory cell types had increased progressively for all donors. (B) Potential T-cell exhaustion was assessed in the harvested cell products. The upregulated inhibitory markers (PD-1 and LAG-3) on pre-transfer indicate the poor proliferation abilities of the cultivated T-cells. It was noted that collective suppressive markers decreased significantly along with the cell expansion. (C) T-cell function was evaluated by measuring the levels of intracellular cytokines. T-cells secreted high amounts of pro-inflammatory (IL-2 and IFN-γ) and anti-inflammatory (IL-4) cytokines upon stimulation (pre-transfer). Harvested T-cells had greatly reduced background levels across all donors. Data are shown as mean ± SD.

