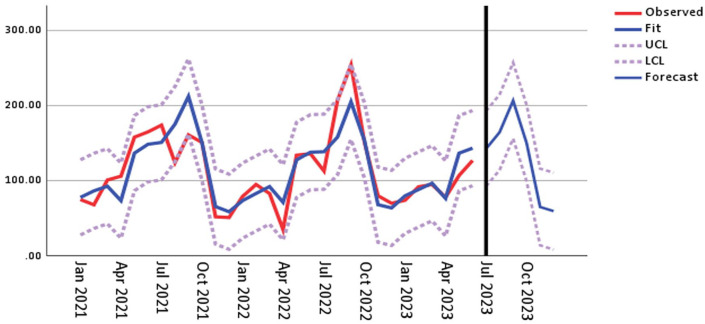
Figure 4.
Interrupted time series analysis for quarterly BCC rates among positive blood cultures in the pre-intervention and intervention periods [where y-axis—number of contaminated blood cultures among positive cultures & x-axis—quarterly intervals in the study period (Abbreviations: LCL, lower control limit; UCL, upper control limit)].

