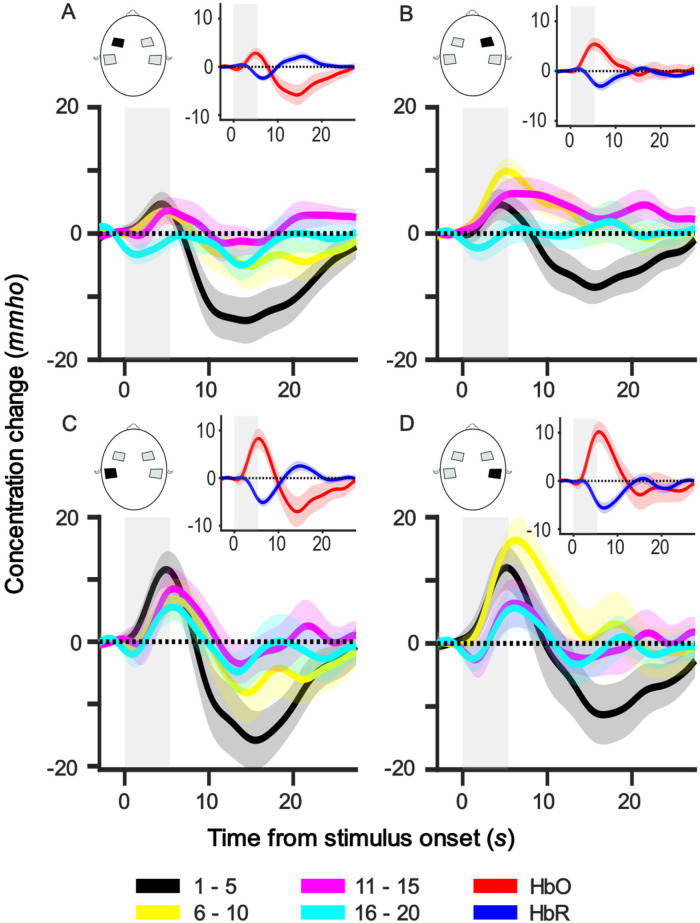
Figure 2.
Group-level average HbO responses for every five trials in each ROI. Each panel shows the responses of one ROI, and the ROI is indicated in the head illustration. The subfigure at the top right corner of each panel illustrates the group-averaged HbO (red) and HbR (blue) responses of the respective ROI over the whole session. Grey bars represent the stimulus duration. Shaded regions represent one standard error of mean (SEM). mmho = mili mho.

