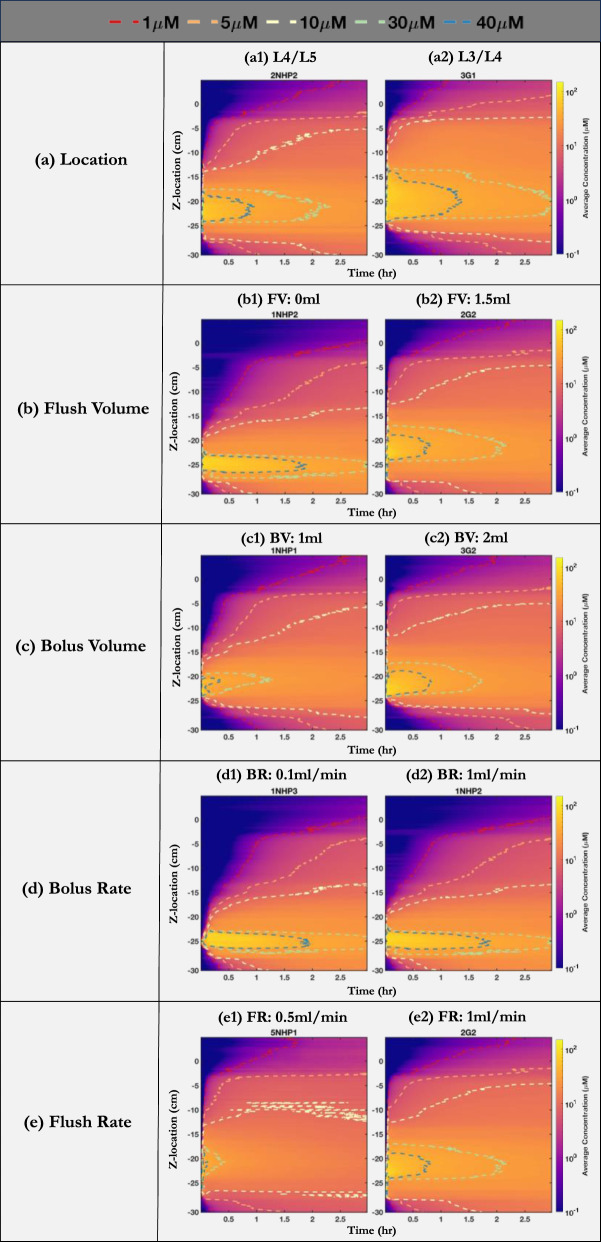
Fig. 5.
The axial distribution of tracer over three hours grouped by a change in (a) Location (b) Flush volume (c) Bolus volume (d) Bolus rate (e) Flush rate. The spatial–temporal plots of the average concentration when (a1, a2) injection location is at L4/L5 and L3/L4, respectively (b1, b2) flush volume is 0 ml and 1.5 ml, respectively (c1, c2) bolus volume is 1 ml and 2 ml, respectively (d1, d2) bolus rate is 0.1 ml/min and 1 ml/min, respectively (e1, e2) flush rate is 0.5 ml/min and 1 ml/min, respectively. The dashed lines represent concentration profiles at 1 µM (red), 5 µM (orange), 10 µM (yellow), 30 µM (green), and 40 µM (blue). FV: flush volume, FR: flush rate, BV: bolus volume, BR: bolus rate

