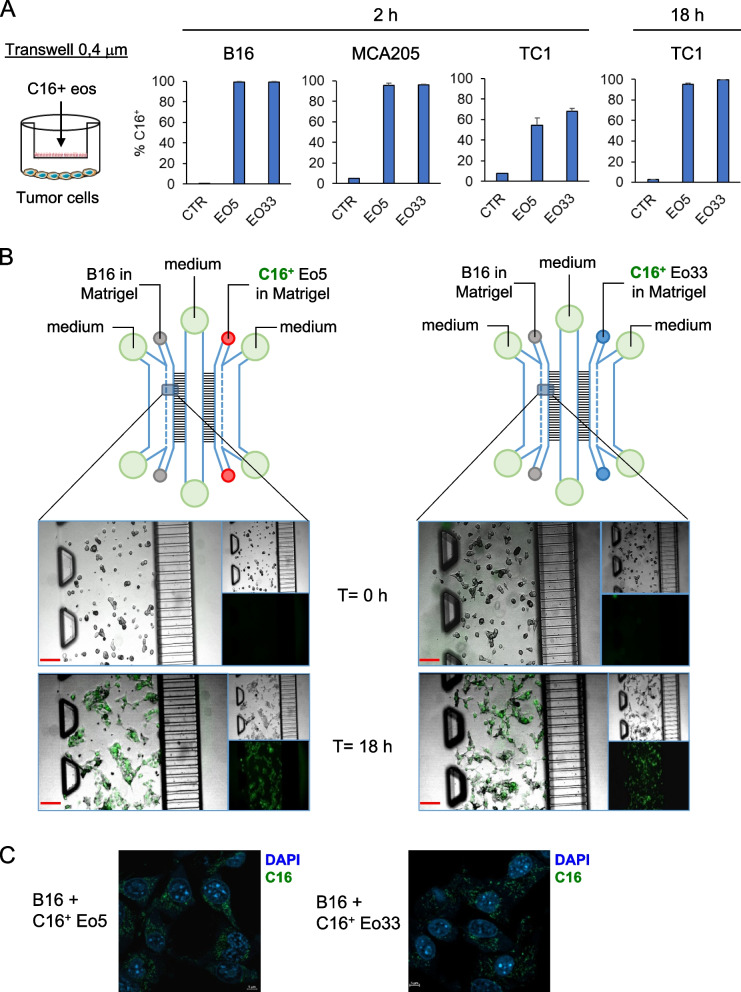
Fig. 2.
Transfer of eosinophil-derived EV to tumor cells. A Eo5 and Eo33 were labelled with Bodipy FL-C16 and then co-cultured with tumor cells separated by a 0.4 μm pore sized insert. C16+ EV intake by tumor cells after the indicated culture times, revealed by flow cytometry analysis of green fluorescence acquisition. CTR: tumor cells cultured alone. Mean (SD) of three replicates is shown. (B) On chip assay for visualizing eosinophil-derived EV incorporation by B16.F10 tumor cells by fluorescence microscopy. C16-labelled Eo5 or Eo33 and B16.F10 cells were loaded in the chip as indicated and incubated for 18 h. Images depict C16+ fluorescence (green) in B16.F10 cells at the beginning of the culture (T = 0 h) and after 18 h incubation. Inserts represent separate visible and green fluorescence channels. Scalebar: 100 μm. C Microphotographs showing incorporation of C16+ EV (green) from Eo5 or Eo33 in the cytoplasm of B16.F10 cells after 18 h. Chips were fixed and stained with DAPI (blue) at the end of the co-culture. Scalebar: 5 μm

