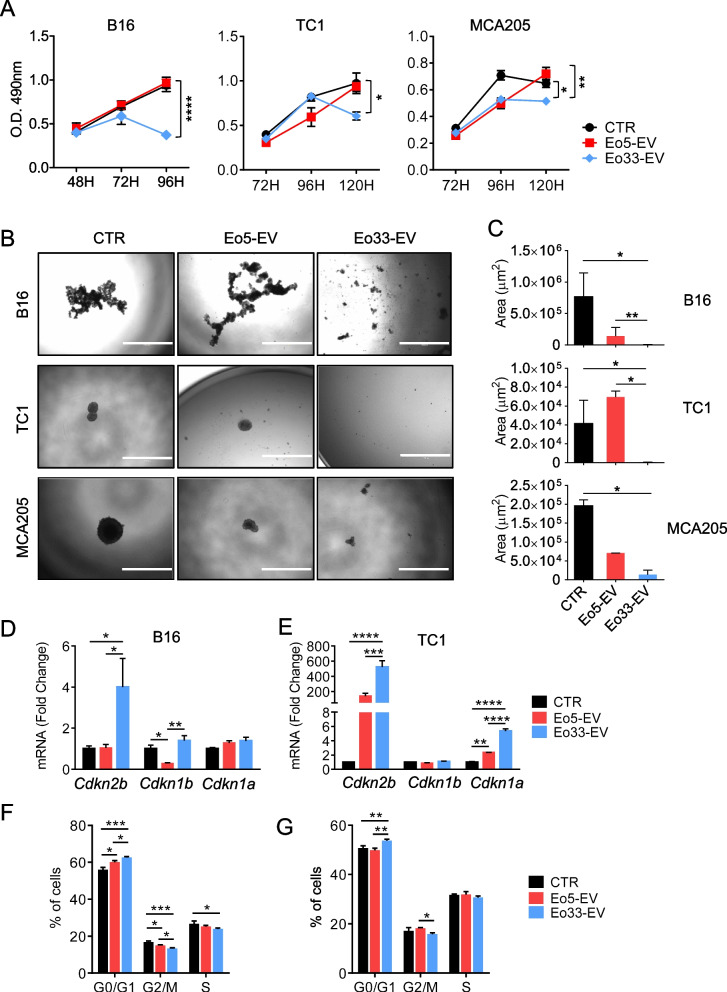
Fig. 3.
Anti-proliferative effects of EV from IL-33 activated eosinophils. A MTS assay of cell viability/proliferation in the indicated tumor cell lines cultured for various times alone (CTR) or in the presence of Eo5-derived EV (Eo5-EV) or Eo33-derived EV (Eo33-EV). Mean (SD) of five replicates is shown. *P < 0.05; **P < 0.01; ****P < 0.0001. B-C Tumor spheroid formation of indicated tumor cell lines cultured in ultralow attachment plates in medium alone (CTR) or with added Eo5-EV or Eo33-EV. B Representative microphotographs of tumor spheroids at day 4. Scalebar:1000 μm. C Quantitative analysis of tumor spheroid growth. Data show the mean spheroid area (SD) at the depicted time (n = 3–12). *P < 0.05; **P < 0.01. Expression of indicated CDKI protein-related genes in (D) B16 and (E) TC1 tumor cells cultured for 24 h alone (CTR) or in the presence of Eo5-EV or Eo33-EV. Mean (SD) of three replicates is shown. *P < 0.05; **P < 0.01; ***P < 0.001; ****P < 0.0001. Flow cytometry analysis of cell cycle in (F) B16 and (G) TC1 cells 24 h after exposure to Eo5-EV or Eo33-EV. Mean (SD) of three replicates is shown. *P < 0.05; **P < 0.01; ***P < 0.001

