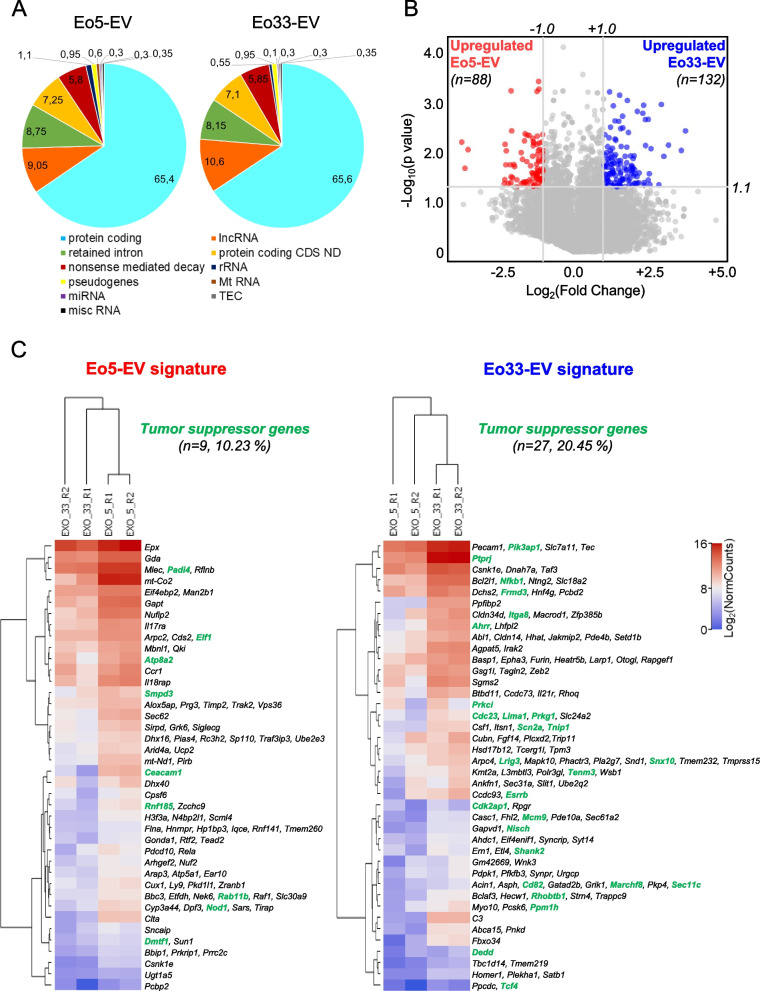
Fig. 6.
RNA-Seq analysis of Eo-EV signatures. A RNA Transcript biotypes distribution into the two indicated EV signatures. Classification was performed according to the ENSEMBL official transcript definition (https://www.ensembl.org/info/genome/genebuild/biotypes.html). Values depict the percentages of the indicated biotypes, expressed as the mean read per each biotype versus the total number of reads. B Distribution of differentially expressed protein-coding mRNAs alongside the indicated Eo-EV signatures. Volcano plot shows the p values (Y axis, negative base 10 logarithm) distribution versus the mean Fold Change (X axis, base 2 logarithm). Colored dots represent significant (-log10(p value) > 1.3) mRNAs whose mean FC is upregulated (log2(Fold Change) > 1, Eo33-EV) or downregulated (log2(Fold Change) < 1, Eo5-EV). Grey lines represent the p value and Fold Change settings employed to select statistically significant upregulated/downregulated mRNAs (italic numbers). C Differential expression of the significant genes (as delineated in panel B) for the Eo-EV signatures compared to the two experimental conditions. Heatmap shows the base 2 logarithm of the 88 and 132 differentially expressed genes into the replicates (R1, R2) for each Eo-EV signature. Dendrograms show hierarchical clustering for experimental conditions (EXO5 for Eo5-EV, EXO33 for Eo33-EV) and mRNAs. Gene expression has been clustered by K-means method (n = 60). Tumor suppressor genes (provided by the CancerMine and TSGene databases) are indicated for each Eo-EV signature with their respective percentage (number of tumor suppressors versus total genes into the signature)

