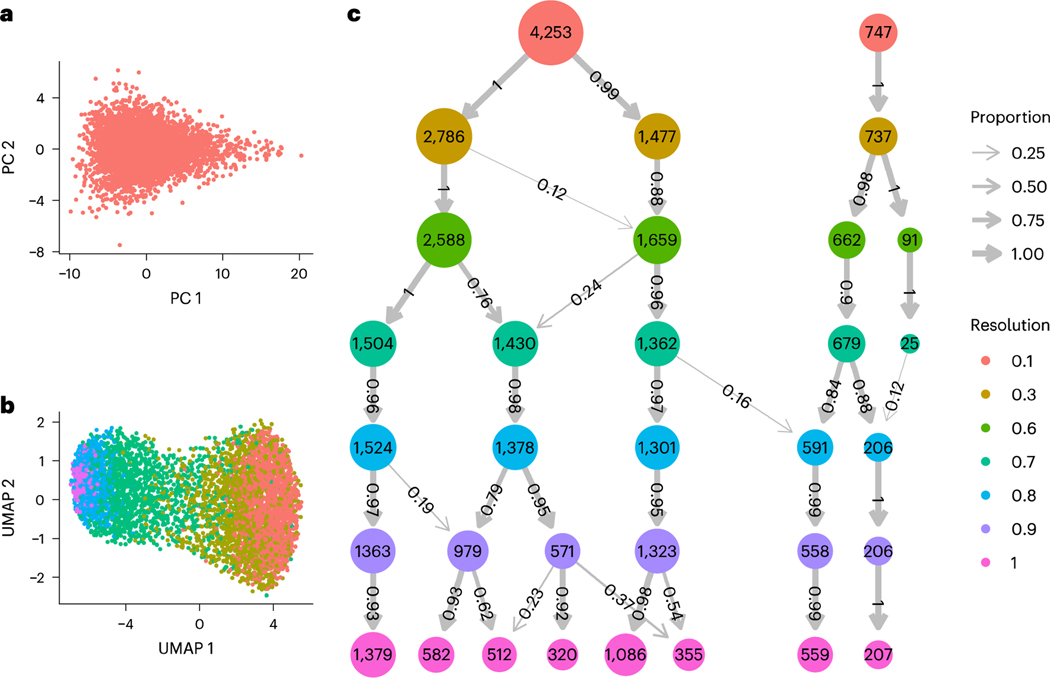
Fig. 1|. Clustering results for applying Seurat’s implementation of the Louvain algorithm to simulated data representing one cell population.
a, PCA plot of 5,000 cells generated from the same joint distribution over 1,000 genes, b, UMAP plot colored by cluster membership when using the default resolution parameter of 0.8. c, A modified clustree visualization of the resulting clusters using Seurat’s implementation of the Louvain algorithm at different resolution parameters, denoted by row. The number of circles in each row represents the number of clusters found with the respective resolution parameter, with the circle’s label and area denoting the number of cells in the cluster. The arrow widths and labels denote what proportion of the cells in each cluster came from the clusters at the previous resolution parameter.

