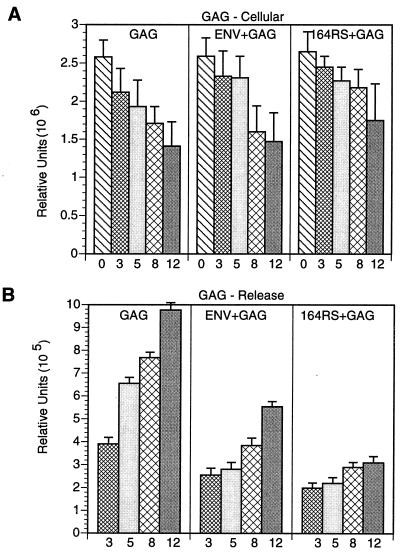
FIG. 3.
Quantitation of Gag proteins. The intracellular levels of the Gag proteins during the times indicated (in hours) under the bars in the figures were quantified by exposing the gel to a PhosphorImager, and the relative units are plotted in panel A. Similar quantification was performed for the Gag proteins released into the media (B). Shown are Gag protein levels in cells expressing Gag (GAG), Gag plus Env, or Env164RS (64RS). The average values for the triplicate assays are plotted in the graph.

