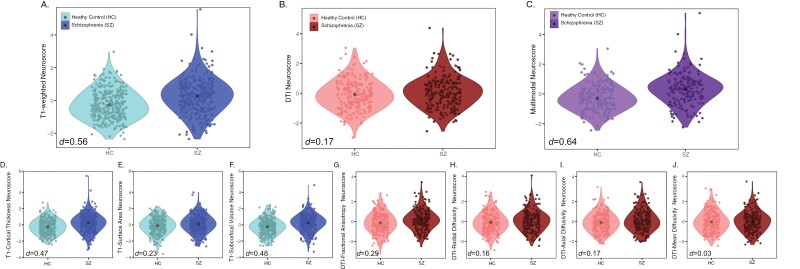
Fig. 2.
Neuroscore distributions. Group-wise distributions and group effect sizes (Cohen’s d) from an independent sample t-test of summary Neuroscores (A–C) and individual measure Neuroscores (D–J). Plots A and D-F show Neuroscores built with T1 measures, plots B and G-L show Neuroscores built with DTI measures, and plot C shows the multimodal Neuroscore. HC, healthy control; SZ, schizophrenia; DTI, diffusion tensor imaging.

