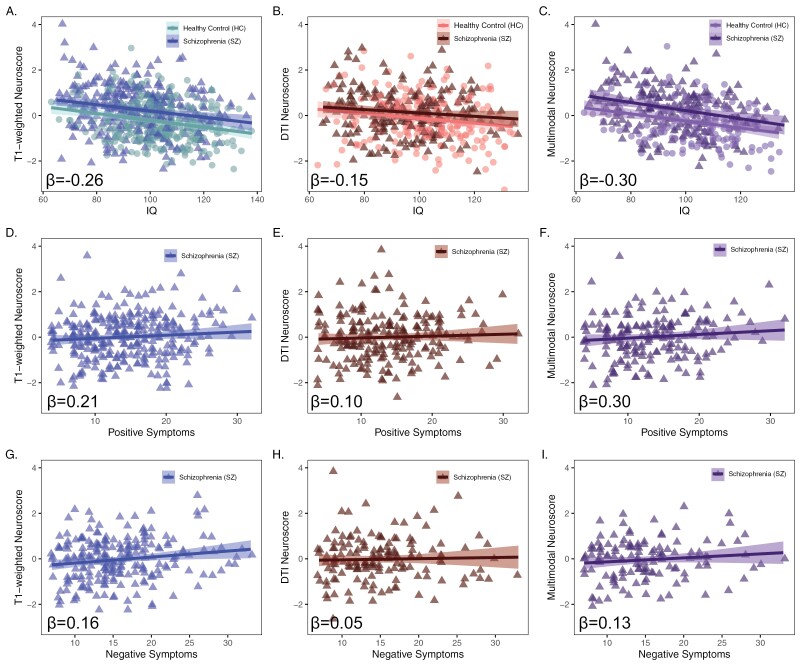
Fig. 3.
Neuroscore associations with psychosis-related factors. Associations between summary Neuroscores and IQ (A–C), positive symptoms (D–F), and negative symptoms (G–I). Betas are standardized effect sizes and represent neuroscore effects from IQ models (covarying for age, sex, and group) and from symptom models (covarying for age and sex). Plots A, D, and G show T1 Neuroscore associations, plots B, E, and H show DTI Neuroscore associations, and plots C, F, and I show multimodal Neuroscore associations. HC, healthy control; SZ, schizophrenia; DTI, diffusion tensor imaging.

