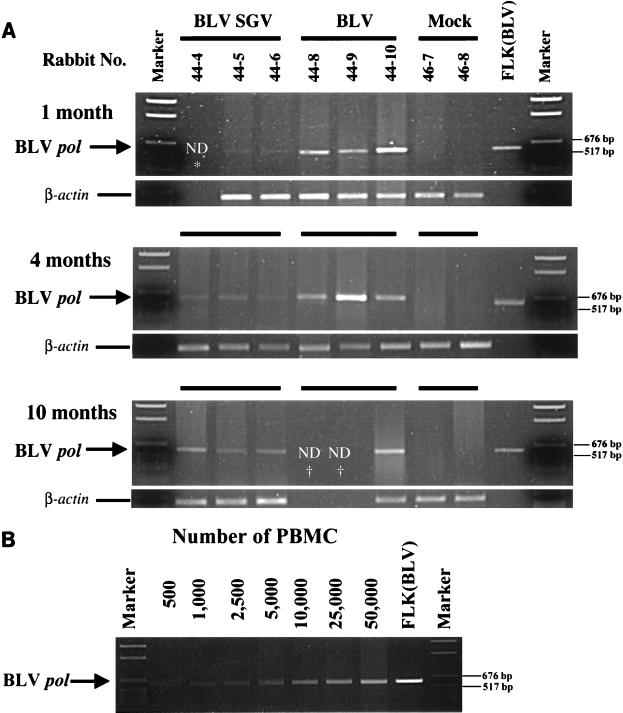
FIG. 3.
Semiquantitative PCR analysis to evaluate differences in proviral load. (A) PCR to detect BLV pol in PBMC from treated rabbits. Rabbit PBMC were harvested at 1, 4, and 10 months postinoculation and subjected to PCR with BLV pol primers KB560 and KB561 (10 × 104 PBMC) or β-actin to control for sample variation (2 × 10⁴ PBMC). Each panel is labeled with month of sample harvest. Lanes are labeled with the source of PBMC DNA by rabbit number and treatment, FLK(BLV) (positive control DNA [100 ng] from BLV-producing fetal lamb kidney cells), or marker (pGem DNA size standard [Promega]). In lower panels, the corresponding rabbit samples are designated by the matching parallel black lines. Positions of BLV pol amplicon (591 bp) and β-actin amplicon (594 bp) are designated. *, not determined (ND) because sample was not available; †, not determined because the animal died before harvest. (B) PCR standard curve. PBMC lysate harvested at 1 month postinoculation from BLV rabbit 44-10 was serially diluted in a range of 5 × 10² to 5 × 10⁴ PBMC and subjected to PCR with BLV pol primers KB560 and KB561. Each lane is labeled with the number of cells used for PCR amplification, FLK(BLV) (positive control DNA [100 ng] from BLV-producing fetal lamb kidney cells), or marker (pGem DNA size standard [Promega]). The arrow on the left indicates the position of BLV pol amplicon (591 bp), and the lines on the right indicate positions of 676- and 571-bp DNA size markers.

