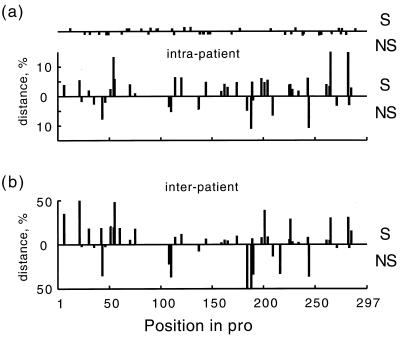
FIG. 1.
Intrapatient (a) and interpatient (b) genetic distances, averaged over patients, at different positions in pro. The upper and lower histograms in each figure correspond to synonymous and nonsynonymous sites, respectively. Dots on the upper horizontal line in panel a show the positions of sporadic mutations (seen only once in the data set).

