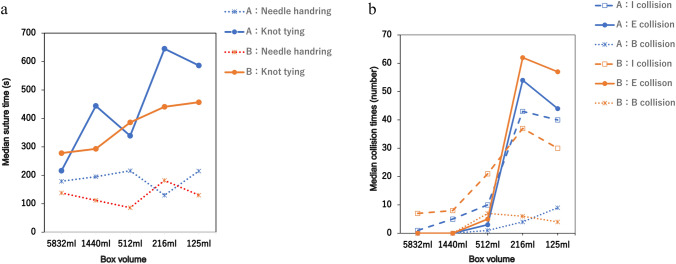
Fig. 3.
Difficult task. a Boxplot of the mean suturing time (y-axis) is plotted against the boxes beginning in the largest box with descending size (x-axis). b Boxplot of the mean collision times (y-axis) is plotted against the boxes beginning in the largest box with descending size (x-axis). I collision: Internal instrument/instrument collision. E collision: External instrument/instrument collision (alert numbers). B collision: instrument/box collision. The two surgeons who possessed an extensive experience with the hinotori™ system are represented using different colors on the graph: one using an orange line and the other using a blue line

