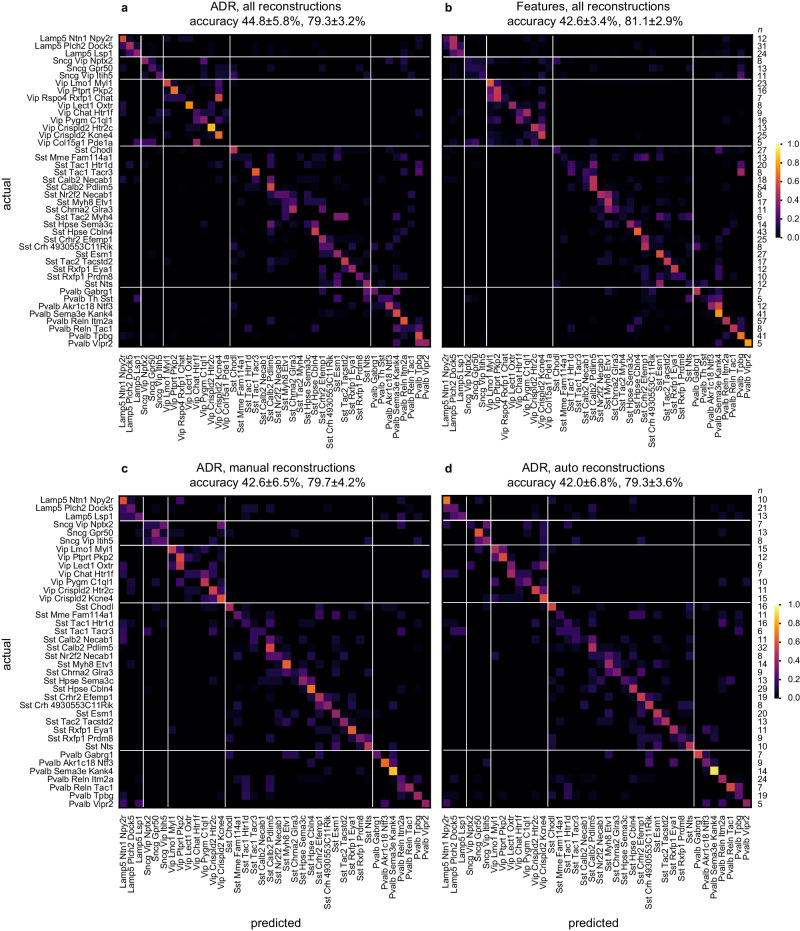
Fig. 3. Comparison of cell type classification accuracy based on the ADR vs. a set of classical morphometric features.
Confusion matrix for the classification of 42 t-types based on axonal and dendritic ADRs (a) and morphometric features (b), using a combination of 246 automatically and 501 manually reconstructed cells. Confusion matrix for the classification of 38 t-types based on ADRs, using 488 manually (c) and automatically (d) reconstructed cells. Accuracy values reported in the headers refer to mean ± s.d. of the overall t-type and t-subclass classifiers, respectively, across cross-validation folds. Rightmost columns list the number of cells in each t-type (n). Source data are provided as a Source Data file.

