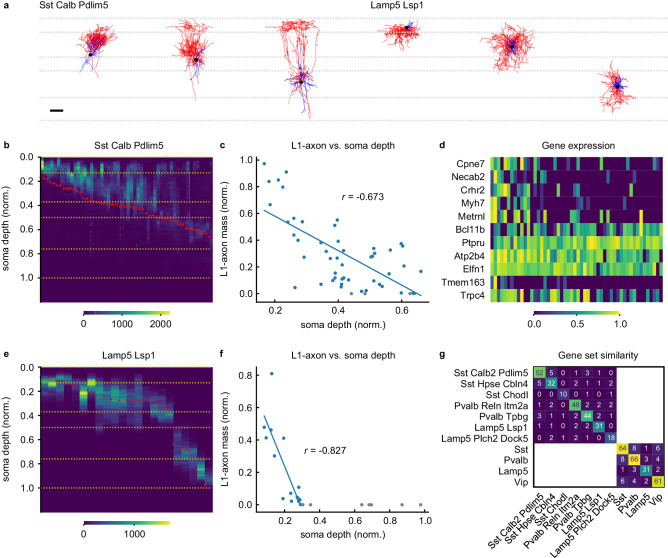
Fig. 4. L1 axonal innervation correlates with expression of subset of genes in Martinotti cells.
Example neurons of Sst Calb2 Pdlim5 and Lamp5 Lsp1 t-types (a). (Horizontal dashed lines indicate cortical layer boundaries. Scale bar, 100 μm.) 1D axonal arbor density for the 52 cells in the Sst Calb2 Pdlim5 t-type (b) and the 22 cells in the Lamp5 Lsp1 t-type (e). (Yellow horizontal dashed lines and red dots indicate cortical layer boundaries and soma depth, respectively). Normalized L1-axon skeletal mass vs. normalized soma depth (0:pia, 1:white matter boundary) for the Sst Calb2 Pdlim5 cells (c) and the Lamp5 Lsp1 cells (f). Lines fitted to cells with nonzero L1 innervation. Cells whose axons don’t reach L1 are shown in gray. Pearson’s r values are shown. d Gene expression vs. L1-axon skeletal mass for the genes selected by the sparse regression analysis. (L1-axon mass decreases from left to right.) g Similarity matrix for the sets of laminae-predicting genes within transcriptomic types and subclasses. (See Table S5.) Each entry denotes the number of genes in the intersection between the corresponding row and column. Source data are provided as a Source Data file.

