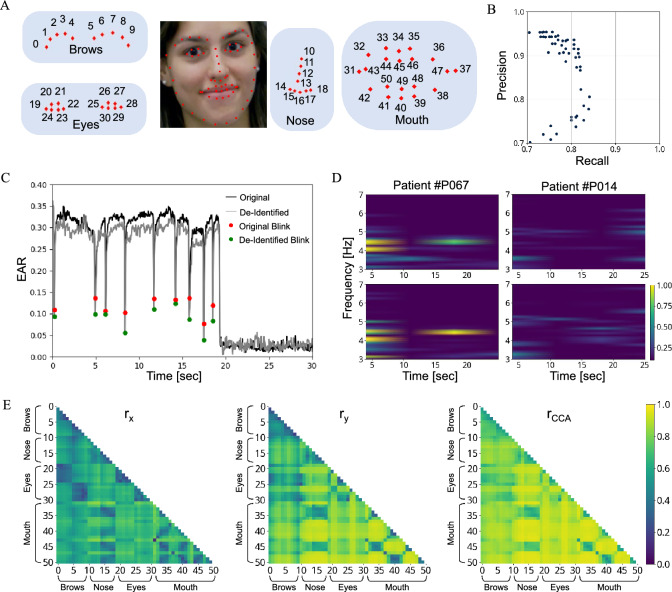
Figure 6.
Facial dynamics invariability. We measured facial movements and compared the differences before/after FaceMotionPreserve processing. (A) Illustration of facial landmarks. (B) Precision–recall curve for blink detection. (C) EAR and detected blinks of a patient before/after FaceMotionPreserve . The de-identified EAR values were temporally similar to the original ones with simultaneous blinks. (D) Mouth movement spectrogram of two patients that all neurologists diagnosed with tremor. Left: a patient whose original and de-identified video both had mean tremor score 2.3. Right: a patient whose original and de-identified video both had mean tremor score 2.0. The upper graphs are original spectrograms and the bottom graphs are de-identified spectrograms. The graphs have peak power in 4–6 Hz and show high similarity between the paired data. (E) Mean correlation of facial landmark pairs. Row i and column j depicts landmark pair (i,j) distance vector’s Pearson correlation coefficient before/after FaceMotionPreserve .

