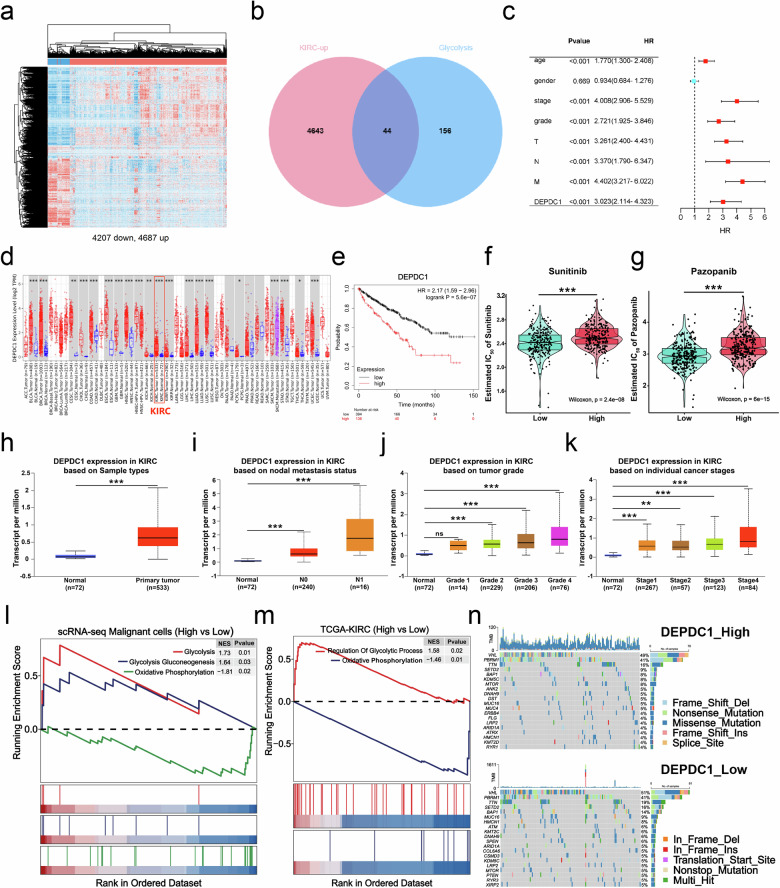
Fig. 2. Glycolysis-related gene DEPDC1 is associated with malignant progression and drug resistance in KIRC.
a Heat map demonstrating the results of the differential expression analyses using the TCGA-KIRC dataset, including 4687 upregulated DEGs and 4207 down-regulated DEGs. b Venn diagram illustrating the intersection of 4687 upregulated DEGs and 200 GRGs. c Univariate Cox regression analysis of DEPDC1 and clinical information. d Timer 2.0 database demonstrating the expression level of DEPDC1 in pan-cancer. e Analysis of the K–M survival curve of DEPDC1 high and low groups in TCGA-KIRC (n = 530). f, g The GDSC database provides IC50 predictions for sunitinib and pazopanib in Endo_p high and low risk score groups. h–k UALCAN database offering insights into the expression levels of DEPDC1 in tumors and normal tissues, different nodal metastasis statuses, different tumor grades, and different cancer stages. l, m The GSEA analysis of high DEPDC1 expression vs low DEPDC1 expression in malignant cells by scRNA-seq and TCGA-KIRC. n The oncoprint of conventional marker genes of RCC with alterations in DEPDC1 high and low groups, where tumor mutation burden is represented for individual samples as a bar chart above the oncoprint. *p < 0.05, **p < 0.01, ***p < 0.001. DEPDC1 DEP domain-containing protein 1, KIRC Kidney clear cell carcinoma, TCGA The Cancer Genome Atlas.

