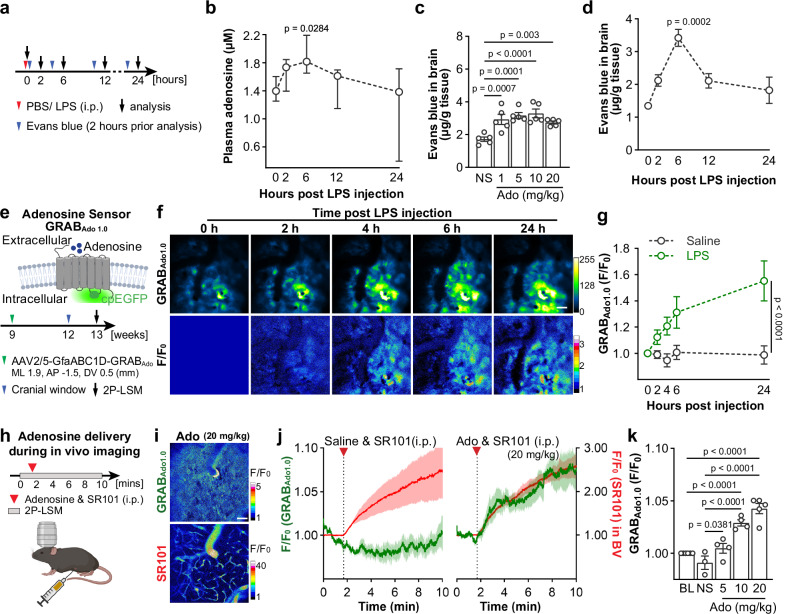
Fig. 1. Peripheral LPS challenges increase adenosine levels in the blood and brain.
a Schematic illustration of the experimental setup and time course for analysis of plasma adenosine levels and Evans blue (EB) injection. b Plasma adenosine concentration rapidly increased post peripheral LPS injection (n = 5 mice for each time point). c EB extravasations increased in the brain after peripheral adenosine injection. (n = 5 mice for each time point). NS: saline; Ado: adenosine. d Peripheral LPS injection increased EB extravasations in the mouse brain (n = 3 mice for each time point). e Schematic illustration of the principle of the GRABAdo1.0 sensors (up) and cortical extracellular adenosine level measurement post LPS injection by using GRABAdo1.0 in vivo 2P-LSM live imaging (down). GfaABC1D-GRABAdo1.0 plasmids were delivered to cortical astrocytes via AAV2/5 injection according to the coordinates indicated in the scheme. f Representative fluorescence images (up) and pseudocolor images (down) of GRABAdo1.0 signals post peripheral LPS injection. Scale bar = 50 μm. g Comparison of relative fluorescence intensities (F.I.) of GRABAdo1.0 acquired in the LPS/Saline injection model. The recording of 0 h after LPS/Saline injection was used as F0. (n = 3 mice per group). h Schematic illustration of injection of adenosine supplemented with SR101 (i.p.) during the in vivo imaging of GRABAdo1.0. i Representative pseudocolor images of GRABAdo1.0 signal and SR101 signal after a peripheral adenosine and SR101 injection. Scale bar = 50 μm. (n = 5 mice). j Increase of GRABAdo1.0 signal (green) after the injection of adenosine (20 mg/kg, i.p.) was concomitant with the increase of SR101 signal (red) in blood vessels (BV), while GRABado1.0 signal is not altered after saline injection. k Relative fluorescence intensities (F.I.) of GRABAdo1.0 upon applications of various dosages of adenosine. The baseline was used as F0. (baseline n = 6 mice, saline n = 3 mice, ado 5 mg/kg n = 4 mice, ado 10 mg/kg n = 4 mice, ado 20 mg/kg n = 5 mice). BL: baseline; NS: saline; Ado: adenosine. Summary data are presented as mean ± SEM in c, d, g, j, k, and as median ± IQR in b. Statistical significance in b was assessed using Kruskal–Wallis test uncorrected Dunn’s test; statistical significance in c, k were assessed by one-way ANOVA, Fisher’s LSD test; statistical significance in g was assessed by two-way ANOVA, Fisher’s LSD test. Source data are provided as a Source Data file. Panels e, h was created with BioRender.com released under a Creative Commons Attribution-NonCommercial-NoDerivs 4.0 International license.

