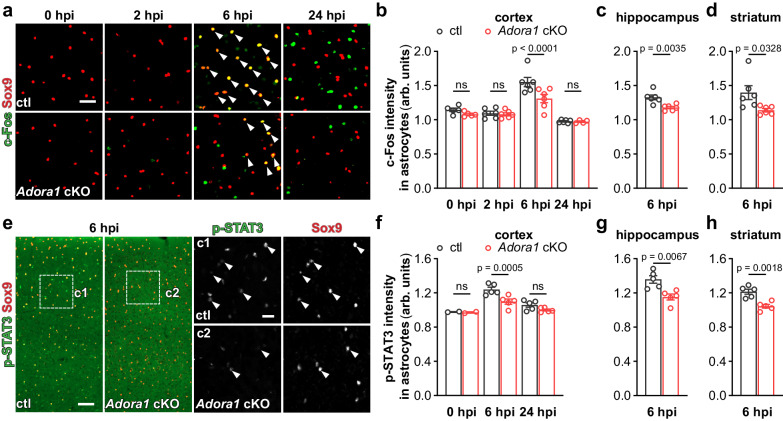
Fig. 3. A1AR-deficient astrocytes are less reactive to the peripheral LPS challenge.
a Representative images of c-Fos expression in cortical Sox9+ astrocytes (arrowheads) post LPS injection. Scale bar = 20 μm. b–d Astrocytic c-Fos immunofluorescence intensity (arbitrary unit, arb. units) was enhanced at 6 hpi in the cortex, hippocampus, and stratum of ctl mice which was inhibited in Adora1 cKO mice (n = 5 mice in ctl and Adora1 cKO at 0 hpi, n = 6 mice in ctl and Adora1 cKO at 2 hpi and 6 hpi, n = 6 mice in ctl at 24 hpi, n = 4 mice in Adora1 cKO at 24 hpi). e Representative images of p-STAT3 expression in cortical Sox9+ astrocytes (arrowheads) post LPS injection. Scale bar = 50 μm in e and 20 μm in c1, c2. f–h Astrocytic p-STAT3 immunofluorescence intensity (arb. units) was enhanced at 6 hpi in the cortex, hippocampus, and stratum of ctl mice which was inhibited in Adora1 cKO mice (n = 2 mice in ctl and Adora1 cKO at 0 hpi, n = 5 mice in ctl and Adora1 cKO at 6 hpi and 24 hpi). Summary data of b–d, f–h are presented as the mean ± SEM. Statistical significance in b, f was assessed by two-way ANOVA, Fisher’s LSD test; statistical significance in (c, d, g, h) were assessed by two tailed unpaired Student’s t test, ns: p > 0.05. Source data are provided as a Source Data file.

