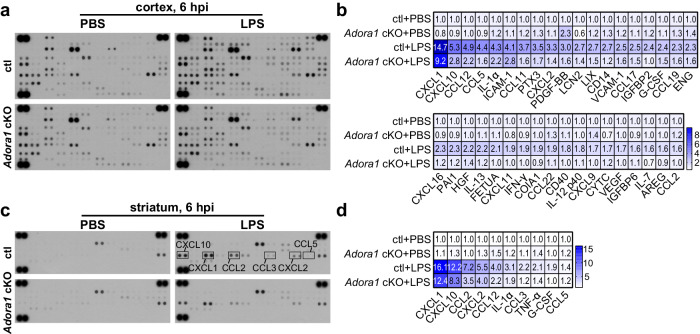
Fig. 5. Astrocytic A1AR deficiency reduces global neuroinflammation induced by an LPS challenge.
a Expression of 111 cytokines in the cortex of ctl and Adora1 cKO mice was measured by a proteomic profiling assay at 6 h after PBS or LPS i.p. injection (samples from 3 mice were pooled for each group). b Cytokines with significant changes compared to ctl (PBS) group were shown in the heatmap. Color bar range is between 0.5 and 9.5, out range value was labelled with dark blue. c Expression of 40 cytokines in the striatum of ctl and Adora1 cKO mice was measured by a proteomic profiling assay at 6 h after PBS or LPS i.p. injection (samples from 3 mice were pooled for each group). d Cytokines with significant changes compared to ctl (PBS) group were shown in the heatmap. Color bar range is between 1 and 16.1. Source data are provided as a Source Data file.

