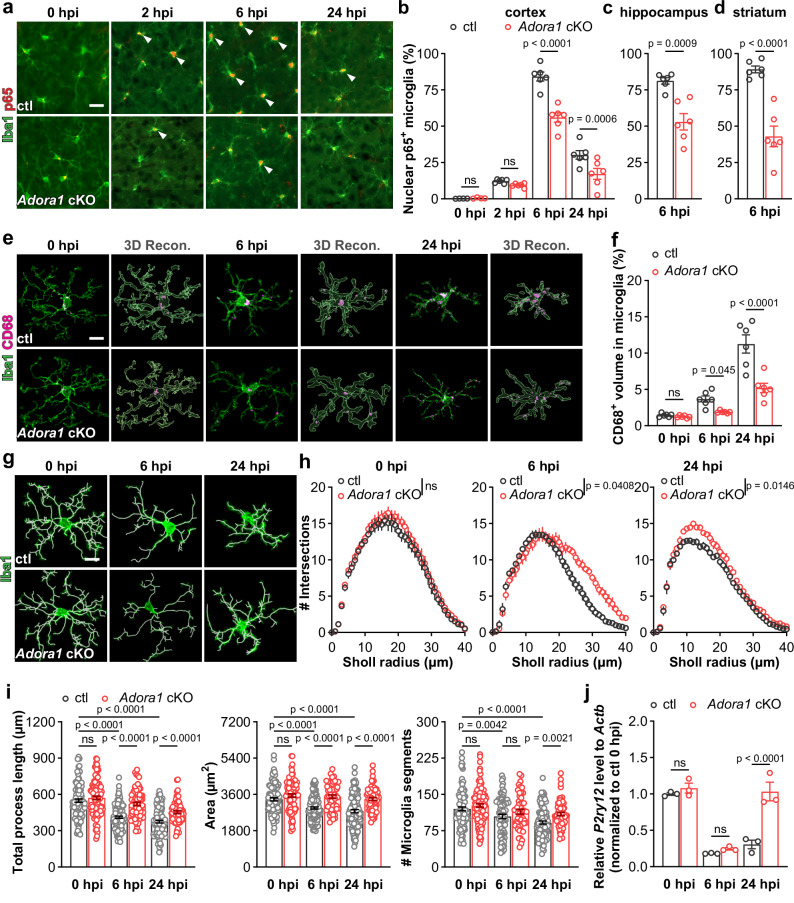
Fig. 6. Astrocytic A1AR deficiency inhibits microglial reaction upon LPS challenge.
a Representative images of p65 immunoreactivity in Iba1+ microglia post LPS injection. Arrowheads indicated Iba1+ microglia with nuclear P65. Scale bar = 20 μm. b–d Proportions of nuclear p65+ microglia in the cortex, hippocampus, and striatum of Adora1 cKO mice were reduced post LPS injection compared to ctl mice. (n = 4 mice in ctl and Adora1 cKO at 0 hpi, n = 6 mice in ctl and Adora1 cKO at 2 hpi, 6 hpi, and 24 hpi). e Representative images and 3D reconstructions of CD68+ and Iba1+ volume post the LPS injection by IMARIS. Scale bar = 10 μm. f Percentage of CD68+ volume in microglia in the cortex of Adora1 cKO mice were reduced post LPS injection compared to ctl mice (n = 6 in ctl and Adora1 cKO at 0 hpi, 6 hpi, and 24 hpi). g Morphology and 3D reconstruction of Iba1+ microglia post the LPS injection. Scale bar = 10 μm. h Sholl analysis of Iba1+ microglia at 0 hpi, 6 hpi, 24 hpi (n = 3 mice per group). i Total process length, area, and segments number of Iba1+ microglia in Adora1 cKO and ctl mice post LPS injection obtained from the IMARIS-based morphological analysis (n = 3 mice per group). j Relative expression of P2ry12 was elevated in the cortex of Adora1 cKO mice at 24 hpi (n = 3 mice per group). Summary data are presented as the mean ± SEM. Statistical significance in b, f, h, i, j were assessed using a two-way ANOVA, Fisher’s LSD test. Statistical significance in c, d is assessed using two tailed unpaired Student’s t test; ns: p > 0.05. Source data are provided as a Source Data file.

