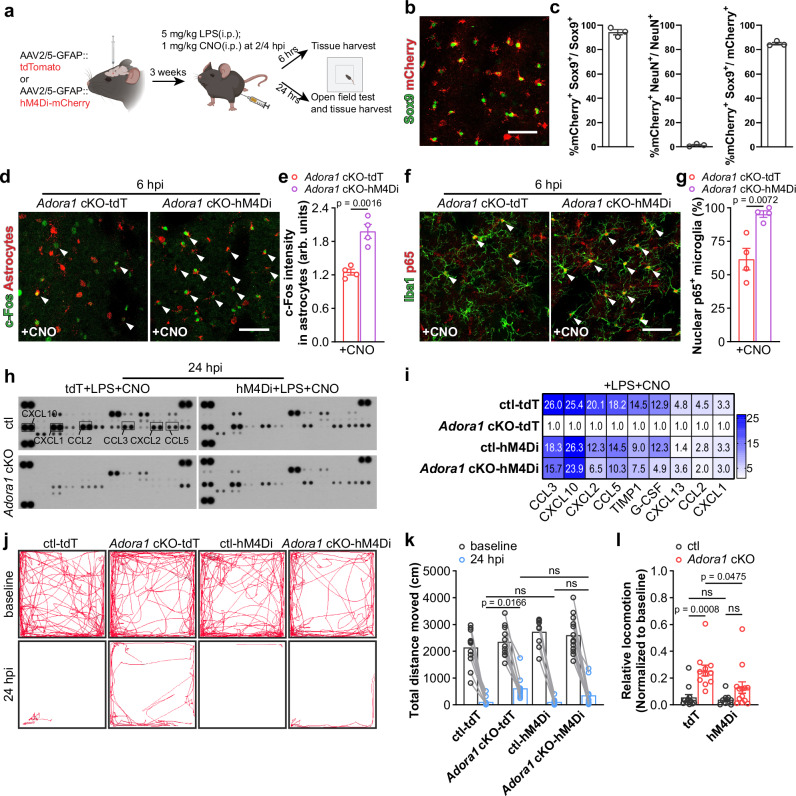
Fig. 8. Activation of Gi signaling in A1AR deficit astrocytes restores the inflammatory response to peripheral LPS challenge.
a Schematic illustration of activation of Gi signaling in A1AR deficit astrocytes experiment employing DREADD hM4Di and experimental plan. b Representative image of hM4Di expression indicated by mCherry in the Sox9+ astrocytes. Scale bar = 50 μm. c hM4Di was expressed in 94% of striatal astrocytes, with >84% specificity (n = 3 mice). d Representative images of immunolabeled reactive A1AR-deficient astrocytes by c-Fos immunostaining after LPS and CNO injection. Scale bar = 50 μm. e Activation of hM4Di increased c-Fos expression in hM4Di-mCherry+ A1AR-deficient astrocytes after LPS injection (n = 4 mice per group). f Representative images of immunoreactivity of p65 in Iba1+ microglia in Adora1 cKO mice with astrocytic tdT or hM4Di expression after LPS and CNO injection. Scale bars = 50 μm. Arrowheads indicates Iba1+ microglia with nuclear p65 expression. g Nuclear p65+ microglia was increased in hM4Di-expressing Adora1 cKO mice after LPS and CNO injection compared to ctl mice (n = 4 mice per group). h The expression of 40 cytokines in the striatum of AAV-infected ctl and Adora1 cKO mice was measured by a proteomic profiling assay after LPS and CNO injection. i Enhancing Gi signaling in Adora1 cKO mice increased cytokine expression after LPS and CNO injection (samples from 3 mice were pooled for each group). j Representative trajectory analysis digitally tracked movement of ctl and Adora1 cKO mice injected with LPS and CNO in the open-field test at 24 hpi. k, l Enhancing Gi signaling in A1AR-deficit astrocyte reduced locomotion in the open-field test (n = 12 mice in ctl-tdT+CNO group, n = 11 mice in Adora1 cKO-tdT+CNO group, n = 9 mice in ctl-hM4Di+CNO group, n = 13 mice in Adora1 cKO-hM4Di+CNO group). Summary data are presented as the mean ± SEM. Statistical significance in e, g was assessed using two tailed unpaired Student’s t test; statistical significance in k, l was assessed using a two-way ANOVA, Fisher’s LSD test, ns: p > 0.05. Source data are provided as a Source Data file. Panel a was created with BioRender.com released under a Creative Commons Attribution-NonCommercial-NoDerivs 4.0 International license.

