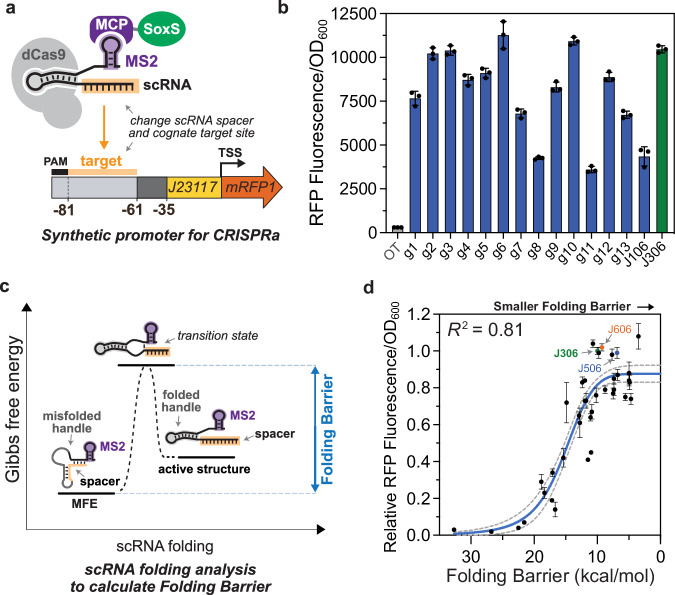
Fig. 2. CRISPRa is sensitive to scRNA target sequence.
a Experimental system for testing the role of scRNA target site sequence on CRISPRa activity. Orthogonal 20 bp target sequences (Supplementary Data 1) were selected at random from the human genome. These sequences replaced the J306 target sequence in the previously described J3 promoter12, and the cognate scRNAs contained the complementary spacer sequences. b CRISPR-activated RFP expression from each promoter variant. In the presence of the cognate scRNA, sequence-dependent expression variation was measured across the set. Bars (blue for g1-J106, green for J306) represent the Fluorescence/OD600 of strains harboring each synthetic promoter and the cognate scRNA. The gray bar (OT) represents the baseline expression of the J3 promoter, obtained by expressing an off-target scRNA (J206). c Folding Barrier (FB) as a critical parameter determining CRISPR-activated expression. Additional kinetic and thermodynamic parameters are described in Supplementary Fig. 2 and Supplementary Method 1. Folding Barrier can be calculated as the height of the energy barrier separating the minimum free energy (MFE) secondary structure of a scRNA from the active structure for CRISPRa. d Folding Barrier predicts the CRISPR-activated expression of promoter-scRNA pairs based on sequence. In addition to the 15 promoters from panel b, 24 new synthetic promoter-scRNA pairs were designed with FBs ranging from 4.7 kcal/mol to 32.7 kcal/mol (Supplementary Data 1). The y-axis values represent Fluorescence/OD600 of strains harboring each promoter variant and expressing the cognate scRNA, relative to the Fluorescence/OD600 of the J3 promoter and the J306 scRNA (green). Blue and red dots respectively indicate the values of the strains expressing the J506 and J606 scRNAs targeting their cognate promoters (Fig. 3). The blue line represents a Hill function fit to the data, and the gray dotted lines represent the 95% confidence interval for the fit. R2 represents the coefficient of determination for the fit. Values in panels b and d represent the average ± standard deviation calculated from n = 3 biologically independent samples. Source data are provided as a Source Data file.

