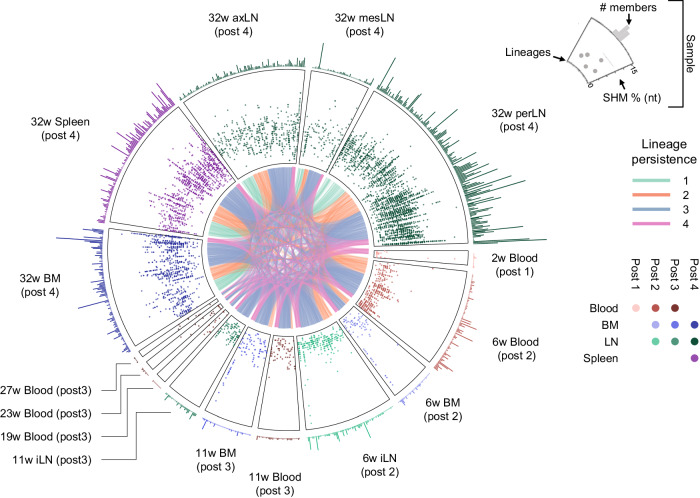
Fig. 2. Multicompartmental longitudinal analysis of spike-elicited B cell lineage evolution.
Each sector represents a sample from H03. Starting from degree 0, the samples are ordered clockwise by sample time point. The base of each sector represents a curved x-axis with each lineage as a point. Each sector is divided into three levels. The outer level shows the number of members of that lineage, the mid-level shows each member’s SHM, and the inner common level connects lineages identified in multiple samples. The inner level is color-coded based on lineage persistence as determined by their identification at multiple time points (post 1, post 2, post 3, and post 4) in the traced data. The mid and outer sectors are color-coded with red, blue, green, and purple for blood, BM, LN, and spleen, respectively, with darker shades for increasing weeks. Source data are provided as a Source Data file.

